The Old New Business Model

Supply networks
Next-generation, self-healing supply networks will feature robustness against supply interruptions. Image by urbans/Shutterstock

15 April 2020 – Business organizations have always been about supply networks, even before business leaders consciously thought in those terms. During the first half of the 20th century, the largest firms were organized hierarchically, like the monarchies that ruled the largest nations. Those firms, some of which had already been international in scope, like the East India Trading Company of previous centuries, thought in monopolistic terms. Even as late as the early 1960s, when I was in high school, management theory ran to vertical and horizontal monopolies. As globalization grew, the vertical monopoly model transformed into multinational enterprises (MNEs) consisted of supply chains of smaller companies supplying subassemblies to larger companies that ultimately distributed branded products (such as the ubiquitous Apple iPhone) to consumers worldwide.

The current pandemic of COVID-19 disease, has shattered that model. Supply chains, just as any other chains, proved only as strong as their weakest link. Requirements for social distancing to control the contagion made it impossible to continue the intense assembly-line-production operations that powered industrialization in the early 20th century. To go forward with reopening the world economy, we need a new model.

Luckily, although luck had far less to do with it than innovative thinking, that model came together in the 1960s and 1970s, and is already present in the systems thinking behind the supply-chain model. The monolithic, hierarchically organized companies that dominated global MNEs in the first half of the 20th century have already morphed into a patchwork of interconnected firms that powered the global economies of the first quarter of the 21st century. That is, up until the end of calendar-year 2019, when the COVID-19 pandemic trashed them. That model is the systems organization model.

The systems-organization model consists of separate functional teams, which in the large-company business world are independent firms, cooperating to produce consumer-ready products. Each firm has its own special expertise in conducting some part of the process, which it does as well or better than its competitors. This is the comparative-advantage concept outlined by David Ricardo over 200 years ago that was, itself, based on ideas that had been vaguely floating around since the ancient Greek thinker Hesiod wrote what has been called the first book about economics, Works and Days, somewhere in the middle of the first millennium BCE.

Each of those independent firms does its little part of the process on stuff they get from other firms upstream in the production flow, and passes their output on downstream to the next firm in the flow. The idea of a supply chain arises from thinking about what happens to an individual product. A given TV set, for example, starts with raw materials that are processed in piecemeal fashion by different firms as it journeys along its own particular path to become, say, a Sony TV shipped, ultimately, to an individual consumer. Along the way, the thinking goes, each step in the process ideally is done by the firm with the best comparative advantage for performing that operation. Hence, the systems model for an MNE that produces TVs is a chain of firms that each do their bit of the process better than anyone else. Of course, that leaves the entire MNE at risk from any exogenous force, from an earthquake to a pandemic, which distrupts operations at any of the firms in the chain. What was originally the firm with the Ricardoan comparative advantage for doing their part, suddenly becomes a hole that breaks the entire chain.

Systems theory, however, provides an answer: the supply network. The difference between a chain and a network is its interconnectedness. In network parlance, the firms that conduct steps in the process are called nodes, and the interconnections between nodes are called links. In a supply chain, nodes have only one input link from an upstream firm, and only one output link to the next firm in the chain. In a wider network, each node has multiple links into the node, and multiple links out of the node. With that kind of structure, if one node fails, the flow of products can bypass that node and keep feeding the next node(s) downstream. This is the essence of a self-healing network. Whereas a supply chain is brittle in that any failure anywhere breaks the whole system down, a self-healing network is robust in that it single-point failures do not take down the entire system, but cause flow paths to adjust to keep the entire system operating.

The idea of providing alternative pathways via multiple linkages flies in the face of Ricardo’s comparative-advantage concept. Ricardo’s idea was that in a collection of competitors producing the same or similar goods, the one firm that produces the best product at the lowest cost drives all the others out of business. Requiring simultaneous use of multiple suppliers means not allowing the firm with the best comparative advantage to drive the others out of business. By accepting slightly inferior value from alternative suppliers into the supply mix, the network accepts slightly inferior value in the final product while ensuring that, when the best supplier fails for any reason, the second-best supplier is there, on line, ready to go, to take up the slack. It deliberately sacrifices its ultimate comparative advantage as the pinnacle of potential suppliers in order to lower the risk of having its supply chain disrupted in the future.

This, itself, is a risky strategy. This kind of network cannot survive as a subnet in a larger, brittle supply chain. If its suppliers and, especially, customers embrace the Ricardo model, it could be in big trouble. First of all, a highly interconnected subnet embedded in a long supply chain is still subject to disruptions anywhere else in the rest of the chain. Second, if suppliers and customers have an alternative path through a firm with better comparative advantage than the subnet, Ricardo’s theory suggests that the subnet is what will be driven out of business. For this alternative strategy to work, the entire industry, from suppliers to customers, has to embrace it. This proviso, of course, is why we’ve been left with brittle supply chains decimated by disruptions due to the COVID-19 pandemic. The alternative is adopting a different, more robust paradigm for global supply networks en masse.

Fiat Money and the Problem of Foreign Exchange Rates

Money
Money exists as metadata representing equal amounts of credit and debit.

26 February 2020 – This essay is a transcription of a paper I wrote last week as part of my studies for a Doctor of Business Administration (DBA) at Keiser University.

Developing a theory that quantitatively determines the rate of exchange between two fiat currencies has been a problem since the Song dynasty, when China’s Jurchen neighbors to the north figured out that they could emulate China’s Tang-dynasty innovation of printing fiat money on paper (Onge, 2017). With two currencies to exchange, some exchange rate was needed. This essay looks to Song-Dynasty economic history to find reasons why foreign exchange (forex) rates are so notoriously hard to predict. The analytical portion starts from the proposition that money itself is neutral (Patinkin & Steiger, 1989), and incorporates recently introduced ideas about money (de Soto, 2000; Masi, 2019), and concludes in favor of the interest rate approach for forex-rate prediction (Scott Hacker, Karlsson, & Månsson, 2012).

Song-Dynasty Economics

After the introduction of paper money, the Song Chinese quickly ran into the problem of inflation due to activities of rent seekers (Onge, 2017). Rent-seeking is an economics term that refers to attempts to garner income from non-productive activities, and has been around since at least the early days of agriculture (West, 2008). The Greek poet Hesiod complained about it in what has been called the first economics text, Works and Days, in which he said, “It is from work that men are rich in flocks and wealthy … if you work, it will readily come about that a workshy man will envy you as you become wealthy” (p. 46).

Repeated catastrophes arose for the Song Chinese after socialist economist Wang Anshi, prime minister from 1069 to 1076, taught officials that they could float government expenditures by simply cranking up their printing presses to flood the economy with fiat currency (Onge, 2017). Inflation exploded while productivity collapsed. The Jurchens took advantage of the situation by conquering the northern part of China’s empire. After they, too, destroyed their economy by succumbing to Wang’s bad advice, the Mongols came from the west to take over everything and confiscate the remaining wealth of the former Chinese Empire to fund their conquest of Eurasia.

Neutrality of Money

The proposition that money is neutral comes from a comment by John Stuart Mill, who, in 1871, wrote that “The relations of commodities to one another remain unaltered by money” (as cited in Patinkin & Steiger, 1989, p. 239). In other words, if a herdsman pays a farmer 50 cows as bride price for one of the farmer’s daughters, it makes no difference whether those 50 cows are worth 100 gold shekels, or 1,000, the wife is still worth 50 cows! One must always keep this proposition in mind when thinking about foreign exchange rates, and money in general. (Apologies for using a misogynistic example treating women as property, but we’re trying to drive home the difference between a thing and its monetary value.)

Another concept to keep in mind is Hernando de Soto’s (2000) epiphany that a house is just a shelter from the weather until it is secured by a property title. He envisioned that such things as titles inhabit what amounts to a separate universe parallel to the physical universe where the house resides. Borrowing a term from philosophy, one might call this a metaphysical universe made up of metadata that describes objects in the physical universe. de Soto’s idea was that existence of the property-title metadata turns the house into wealth that can become capital through the agency of beneficial ownership.

If one has beneficial ownership of a property title, one can encumber it by, for example, using it to secure a loan. One can then invest the funds derived from that loan into increased productive capacity of a business–back in the physical universe. Thus, the physical house is just an object, whereas the property title is capital (de Soto, 2000). It is the metaphysical capital that is transferable, not the physical property. In the transaction between the farmer and the herdsman above, what occurred was a swap between the two parties of de-Sotoan capital derived from beneficial ownership of the cattle and of the daughter, and it happened in the metaphysical universe.

What Is Money, Really?

Much of the confusion about forex rates arises from conflating capital and money. Masi (2019) speculated that money in circulation (e.g., M1) captures only half of what money really is. Borrowing concepts from both physics and double-entry bookkeeping, he equated money with a two-part conserved quantity he referred to as credit/debit. (Note that here the words “credit” and “debit” are not used strictly according to their bookkeeping definitions.) Credit arises in tandem with creation of an equal amount of debit. Thus, the net amount of money (equaling credit-minus-debit) is always the same: zero. A homeowner raising funds through a home-equity line of credit (HELOC) does not affect his or her total wealth. The transaction creates funds (credit) and debt (debit) in equal amounts. Similarly, a government putting money into circulation, whether by printing pieces of paper, or by making entries in a digital ledger, automatically increases the national debt.

Capital, on the other hand, arises, as de Soto (2000) explained, as metadata associated with property. The confusion comes from the fact that both capital and money are necessarily measured in the same units. While capital can increase through, say, building a house, or it can decrease by, for example, burning a house down, the amount of money (as credit/debit) can never change. It’s always a net zero.

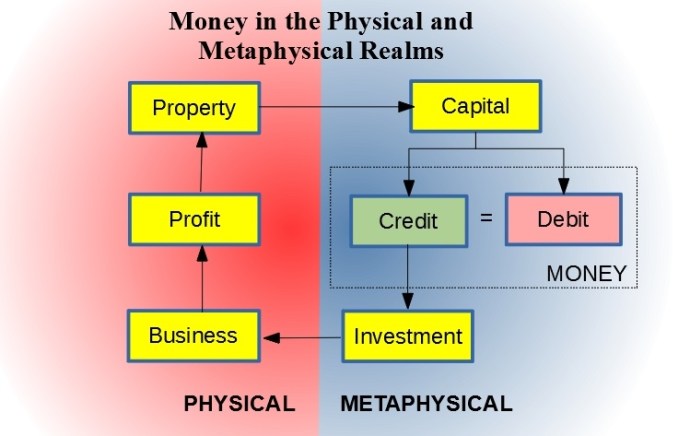
The figure above shows how de Soto’s (2000) and Masi’s (2019) ideas combine. The cycle begins on the physical side with beneficial ownership of some property. On the metaphysical side, that beneficial ownership is represented by capital (i.e., property title). That capital can be used to secure a loan, which creates credit and debit in equal amounts. The beneficial owner is then free to invest the credit in beneficial ownership of a productive business back on the physical side. The business generates profits (e.g., inventory) that the owner retains as an increase in property.

The debit that was created along the way stays on the metaphysical side as an encumbrance on the total capital. The system is limited by the quantity of capital that can be encumbered, which limits the credit that can be created to fund continuing operations. The system grows through productivity of the business, which increases the property that can be represented by new capital, which can be encumbered by additional credit/debit creation, which can then fund more investment, and so forth. Note that the figure ignores, for simplicity, ongoing investment required to maintain the productive assets, and interest payments to service the debt.

Wang’s mismanagement strategy amounted to deficit spending–using a printing press to create credit/debit faster than the economy can generate profit to be turned into an increasing stock of capital (Onge, 2017). Eventually, the debt level rises to encumber the entire capital supply, at which point no new credit/debit can be created. Continued running of Wang’s printing press merely creates more fiat money to chase the same amount of goods: inflation. Thus, inflation arises from having the ratio of money creation divided by capital creation greater than one.

In Song China, investment collapsed due to emphasis on rent seeking, followed by collapsing productivity (Onge, 2017). Hyperinflation set in as the government cranked the printing presses just to cover national-debt service. Finally, hungry outsiders, seeing the situation, swooped in to seize the remaining productive assets. First it was the Jurchens, then the Mongols.

Forex and Hyperinflation

The Song Chinese quickly saw Wang’s mismanagement at work, and kicked him out of office (Onge, 2017). They, however, failed to correct the practices he’d introduced. Onge (2017) pointed out that China’s GDP per person at the start of the Song dynasty was greater than that of 21st-century Great Britain. Under Wang’s policies, decline set in around 1070–80, and GDP per person had fallen by 23% by 1120. Population growth changed to decline. Productivity cratered. Inflation turned to hyperinflation. The Jurchen, without the burden of Wang’s teachings, were slower to inflate their currency.

As Chinese inflation increased relative to that of the Jurchen, exchange rates between Jurchen and Chinese currencies changed rapidly. The Jurchen fiat currency became stronger relative to that of the Chinese. This tale illustrates how changes in forex rates follow relative inflation between currencies, and argues for using the interest rate approach to predict future equilibrium forex rates (Scott Hacker, et al., 2012).

Conclusion

Forex rates are free to fluctuate because money is neutral (Patinkin & Steiger, 1989). Viewing money as a conserved two-fluid metaphysical quantity (Masi, 2019) shows how a country’s supply of de-Sotoan capital constrains the money supply, and shows how an economy grows through profits from productive businesses (de Soto, 2000). It also explains inflation as an attempt to increase the money supply faster than the capital supply can grow. The mismatch of relative inflation affects equilibrium forex rates by increasing strength of one currency relative to another, and argues for the interest-rate approach to forex theory (Scott Hacker, et al., 2012).

References

de Soto, H. (2000). The mystery of capital. New York, NY: Basic Books.

Masi, C. G. (2019, June 19). The Fluidity of Money. [Web log post]. Retrieved from http://cgmblog.com/2019/06/19/the-fluidity-of-money/

Onge, P. S. T. (2017). How paper money led to the Mongol conquest: Money and the collapse of Song China. The Independent Review, 22(2), 223-243.

Patinkin, D., & Steiger, O. (1989). In search of the “veil of money” and the “neutrality of money”: A note on the origin of terms. Scandinavian Journal of Economics, 91(1), 131.

Scott Hacker, R., Karlsson, H. K., & Månsson, K. (2012). The relationship between exchange rates and interest rate differentials: A wavelet approach. World Economy, 35(9), 1162–1185.

West, M. L. [Ed.] (2008). Hesiod: Theogony and works and days. Oxford, UK; Oxford University Press.

Management Studies with High Temporal Resolution

F2019-10-30
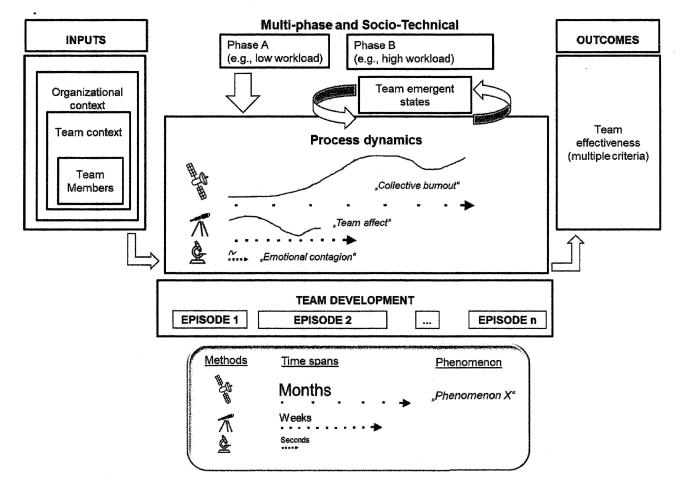
A temporal framework to understand team dynamics with high resolution. Image by Klonek et al

30 October 2019 – The essay below was posted to the Keiser University DBA 710 Week 8 Discussion Forum. It is reproduced here in the hope that readers of this blog will find this peek into state-of-the-art management research interesting.

This posting is a bit off topic for Week 8, but it reviews a paper that didn’t cross my desk in time to be included in last week’s discussions, where it would have been more appropriate. In fact, the copy of the paper I received was a manuscript version of a paper accepted by the journal Organizational Psychology Review that is at the printer now.

The paper, written by an Australian-German team, covers recent developments in measuring variables apropos management of decision teams in various situations (Klonek, Gerpott, Lehmann-Willenbrock & Parker, in press). As we saw last week, there is a lot of work to be done on metrology of leadership and management variables. The two main metrology-tool classifications are case studies (Pettigrew, 1990) and surveys (Osei-Kyei & Chan, 2018). Both involve time lags that make capturing data in real time and assuring its freedom from bias impossible (Klonek, Gerpott, Lehmann-Willenbrock & Parker, in press). Decision teams, however, present a dynamic environment where decision-making processes evolve over time (Lu, Gao & Szymanski, 2019). To adequately study such processes requires making time resolved measurements quickly enough to follow these dynamic changes.

Recent technological advances change that situation. Wireless sensor systems backed by advanced data-acquisition software make in possible to unobtrusively monitor team members’ activities in real time (Klonek, Gerpott, Lehmann-Willenbrock & Parker, in press). The paper describes how management scholars can use these tools to capture useful information for making and testing management theories. It provides a step-by-step breakdown of the methodology, including determining the appropriate time-resolution target, choosing among available metrology tools, capturing data, organizing data, and interpreting data. It covers working on time scales from milliseconds to months, and mixed time scales. Altogether, the paper provides invaluable information for anyone intending to link management theory and management practice in an empirical way (Bartunek, 2011).

References

Bartunek, J. M. (2011). What has happened to Mode 2? British Journal of Management, 22(3), 555–558.

Klonek, F.E., Gerpott, F., Lehmann-Willenbrock, N., & Parker, S. (in press). Time to go wild: How to conceptualize and measure process dynamics in real teams with high resolution? Organizational Psychology Review.

Lu, X., Gao, J. & Szymanski, B. (2019) The evolution of polarization in the legislative branch of government. Journal of the Royal Society Interface, 16: 20190010.

Osei-Kyei, R., & Chan, A. (2018). Evaluating the project success index of public-private partnership projects in Hong Kong. Construction Innovation, 18(3), 371-391.

Pettigrew, A. M. (1990). Longitudinal Field Research on Change: Theory and Practice. Organization Science, 1(3), 267–292.

Making Successful Decisions

Project Inputs
External information about team attributes, group dynamics and organizational goals ultimately determine project success.

4 September 2019 – I’m in the early stages of a long-term research project for my Doctor of Business Administration (DBA) degree. Hopefully, this research will provide me with a dissertation project, but I don’t have to decide that for about a year. And, in the chaotic Universe in which we live a lot can, and will, happen in a year.

I might even learn something!

And, after learning something, I might end up changing the direction of my research. Then again, I might not. To again (as I did last week ) quote Winnie the Pooh: “You never can tell with bees!

No, this is not an appropriate forum for publishing academic research results. For that we need peer-reviewed scholarly journals. There are lots of them out there, and I plan on using them. Actually, if I’m gonna get the degree, I’m gonna have to use them!

This is, however, an appropriate forum for summarizing some of my research results for a wider audience, who might just have some passing interest in them. The questions I’m asking affect a whole lot of people. In fact, I dare say that they affect almost everyone. They certainly can affect everyone’s thinking as they approach teamwork at home and at work, as well as how they consider political candidates asking for their votes.

For example, a little over a year from now, you’re going to have the opportunity to vote for who you want running the United States Government’s Executive Branch as well as a few of the people you’ll hire (or re-hire) to run the Legislative Branch. Altogether, those guys form a fairly important decision-making team. A lot of folks have voiced disapprobation with how the people we’ve hired in the past have been doing those jobs. My research has implications for what questions you ask of the bozos who are going to be asking for your votes in the 2020 elections.

One of the likely candidates for President has shown in words and deeds over the past two years (actually over the past few decades, if you care to look that far into his past) that he likes to make decisions all by his lonesome. In other words, he likes to have a decision team numbering exactly one member: himself.

Those who have paid attention to this column (specifically the posting of 17 July) can easily compute the diversity score for a team like that. It’s exactly zero.

When looking at candidates for the Legislative Branch, you’ll likely encounter candidates who’re excessively proud to promise that they’ll consult that Presidential candidate’s whims regarding anything, and support whatever he tells them he wants. Folks who paid attention to that 17 July posting will recognize that attitude as one of the toxic group-dynamics phenomena that destroy a decision team’s diversity score. If we elect too many of them to Congress and we vote Bozo #1 back into the Presidency, we’ll end up with another four years of the effective diversity of the U.S. Government decision team being close to or exactly equal to zero.

Preliminary results from my research – looking at results published by other folks asking what diversity or lack thereof does to the results of projects they make decisions for – indicates that decision teams with zero effective diversity are dumber than a box of rocks. Nobody’s done the research needed to make that statement look anything like Universal Truth, but several researchers have looked at outcomes of a lot of projects. They’ve all found that more diverse teams do better.

Anyway, what this research project is all about is studying the effect of team-member diversity on decision-team success. For that to make sense, it’s important to define two things: diversity and success. Even more important is to make them measurable.

I’ve already posted about how to make both diversity and success measurable. On 17 July I posted a summary of how to quantify diversity. On 7 August I posted a summary of my research (so far) into quantifying project success as well. This week I’m posting a summary of how I plan to put it all together and finally get some answers about how diversity really affects project-development teams.

Methodology

What I’m hoping to do with this research is to validate three hypotheses. The main hypothesis is that diversity (as measured by the Gini-Simpson index outlined in the 17 July posting) correlates positively with project success (as measured by the critical success index outlined in the 7 August posting). A secondary hypothesis is that four toxic group-dynamic phenomena reduce a team’s ability to maximize project success. A third hypothesis is that there are additional unknown or unknowable factors that affect project success. The ultimate goal of this research is to estimate the relative importance of these factors as determinants of project success.

Understanding the methodology I plan to use begins with a description of the information flows within an archetypal development project. I then plan on conducting an online survey to gather data on real world projects in order to test the hypothesis that it is possible to determine a mathematical function that describes the relationship between diversity and project success, and to elucidate the shape of such a function if it exists. Finally, the data can help gauge the importance of group dynamics to team-decision quality.

The figure above schematically shows the information flows through a development project. External factors determine project attributes. Personal attributes, such as race, gender, and age combine with professional attributes, such as technical discipline (e.g., electronics or mechanical engineering) and work experience to determine raw team diversity. Those attributes combine with group dynamics to produce an effective team diversity. Effective diversity affects both project planning and project execution. Additional inputs from stakeholder goals and goals of the sponsoring enterprise also affect the project plans. Those plans, executed by the team, determine the results of project execution.

The proposed research will gather empirical data through an online survey of experienced project managers. Following the example of researchers van Riel, Semeijn, Hammedi, & Henseler (2011), I plan to invite members of the Project Management Institute (PMI) to complete an online survey form. Participants will be asked to provide information about two projects that they have been involved with in the past – one they consider to be successful and one that they consider less successful. This is to ensure that data collected includes a range of project outcomes.

There will be four parts to the survey. The first part will ask about the respondent and the organization sponsoring the project. The second will ask about the project team and especially probe the various dimensions of team diversity. The third will ask about goals expressed for the project both by stakeholders and the organization, and how well those goals were met. Finally, respondents will provide information about group dynamics that played out during project team meetings. Questions will be asked in a form similar to that used by van Riel, Semeijn, Hammedi, & Henseler (2011): Respondents will rate their agreement with statements on a five- or seven-step Likert scale.

The portions of the survey that will be of most importance will be the second and third parts. Those will provide data that can be aggregated into diversity and success indices. While privacy concerns will make masking identities of individuals, companies and projects important, it will be critical to preserve links between individual projects and data describing those project results.

This will allow creating a two-dimensional scatter plot with indices of team diversity and project success as independent and dependent variables respectively. Regression analysis of the scatter plot will reveal to what extent the data bear out the hypothesis that team diversity positively correlates with project success. Assuming this hypothesis is correct, analysis of deviations from the regression curve (n-way ANOVA) will reveal the importance of different group dynamics effects in reducing the quality of team decision making. Finally, I’ll need to do a residual analysis to gauge the importance of unknown factors and stochastic noise in the data.

Altogether this research will validate the three hypotheses listed above. It will also provide a standard methodology for researchers who wish to replicate the work in order to verify or extend it. Of course, validating the link between team diversity and decision-making success has broad implications for designing organizations for best performance in all arenas of human endeavor.

References

de Rond, M., & Miller, A. N. (2005). Publish or perish: Bane or boon of academic life? Journal of Management Inquiry, 14(4), 321-329.

van Riel, A., Semeijn, J., Hammedi, W., & Henseler, J. (2011). Technology-based service proposal screening and decision-making effectiveness. Management Decision, 49(5), 762-783.

Do the Math

Applied Math teacher
Throughout history, applied mathematics has been the key to human development. By Elnur/Shutterstock

31 July 2019 – Over the millennia that philosophers have been doing their philosophizing, a recurring theme has been the quest to come up with some simple definition of what sets humans apart from so-called “lower” animals. This is not just idle curiosity. From Aristotle on, folks have realized that understanding what makes us human is key to making the most of our humanity. If we don’t know who we are, how can we figure out how to be better?

In recent decades, however, it’s become clear that this is a fool’s errand. Such a definition of humanity doesn’t exist. Instead, what sets humans apart is a suite of characteristics, such as two eyes in the front of a head that’s set up on a stalk over a main torso, with two legs down below and a couple of arms on each side ending with wiggly fingers and opposable thumbs; a brain able to use sophisticated language; and so forth. Not every human has all of them (for example, I had a friend in Arizona who’d managed to lose his right arm and shoulder without losing his humanity) and a lot of non-humans have some of them (for example, chimpanzees use tools a lot). What marks humans as humans is having most of these characteristics, and what marks non-humans as not human is lacking a lot of them.

On the other hand, there is one thing that most humans are capable of that most non-humans aren’t: humans are capable of doing the math.

Yeah, crows can count past two. I hear that pigeons are good at pattern recognition. But, I’m talking about mathematical reasoning more sophisticated than counting past seven. That’s something most humans can do, and most other animals can’t.

Everybody has their mathematical limitations.Experience indicates that one’s mathematical limitations are mostly an issue of motivation. At some point, just about everybody decides that it’s just not worth putting in the effort needed to learn any more math than they already know.

That’s because learning math is hard. It’s the biggest learning challenge most of us ever face. Most of us give up long before reaching the limits of our innate ability to puzzle it out.

Luckily, there are some who are willing to push the limits, and master mathematical puzzles that no human has solved before. That’s lucky because without people like them, human progress would quickly stop.

Even better, those people are often willing – even anxious – to explain what they’ve puzzled out to the rest of us. For example, we have geometry because a bunch of Egyptians puzzled out how to design pyramids, stone temples and other stuff they wanted to build, then proudly explained to their peers exactly how to do it. We have double-entry accounting because folks in the Near East wanted to keep track of what they had, figured out how to do it, and taught others to help. We’ve got calculus because Sir Isaac Newton and a bunch of his buddies figured out how to predict what the visible planets would do next, then taught it to a bunch of physics students.

It’s what we like to call “Applied Mathematics,” and it’s responsible for most of the progress people have made since the days of stone knives and bear skins. Throughout history, we’ve all stood around scratching our heads about things we couldn’t make sense of until some bright guy (or gal) worked out the right mathematics and applied it to the problem. Then, suddenly what had been unintelligible became understandable.

These days, what I think is the bleeding edge of applied mathematics is nonlinear dynamics and chaos. Maybe there’s some fuzzy logic thrown into the mix, too. Most of the math tools needed to understand (as in “make mathematical models using”) these things is pretty well in hand. What we need to do is apply such tools to the problems that today vex us.

A case in point is the Gini-Simpson Diversity Index I described in this blog two weeks ago. That is a small brick in the wall of a structure that I hope will someday help us avoid making so many dumb choices. Last week I ran across another brick in a paper written by a couple of computer science professors at my old alma mater Rensselaer Polytechnic Institute (aka RPI, or as we used to call it when I was there as a graduate student, “the Tute”). This bit of intellectual flotsam describes a mathematical model the authors use to predict how political polarization evolves in the U.S. Congress.

Polarization is one of four (at my last count) toxic group-dynamics phenomena that make collaborative decision making fail. Basically, the best decisions are made by groups that work together to reach a consensus. We get crappy decisions when the group’s dynamics break down.

The RPI model is a nonlinear differential equation describing an aspect of the dynamics of decision-making teams. Specifically, it quantifies conditions that determine whether decision teams evolve toward consensus or polarization. We see today what happens when Congress evolves toward polarization. The authors’ research shows that prior to about 1980 Congress evolved toward consensus. Seeing this dynamic at work mathematically gives us a leg up on figuring out why, and maybe doing something about it.

I’m not going to go into the mathematical model the RPI paper presents. The study of nonlinear dynamical systems is far outside the editorial focus of this column. At this point, I’m not going to talk about solutions the paper might suggest for toxic U.S. Government polarization, either. The theory is not well enough developed yet to provide meaningful suggestions.

The purpose of this posting is to point out that application of sophisticated mathematics is necessary for solving society’s most intractable problems. As I said above, not everybody is ready and willing to become expert in using such tools. That’s not necessary. What I hope you’ll walk away with today is an appreciation of applied mathematics’ importance for societal development, and a willingness to support STEM (science, technology, engineering and mathematics) education throughout our school system. Finally, I hope you’ll encourage students who show an interest to learn the techniques and follow STEM careers.

Computing Diversity

Decision Team
Diversity of membership in decision-making teams leads to better outcomes. By Rawpixel.com/Shutterstock

17 July 2019 – It’s come to my attention that a whole lot of people don’t know how to calculate a diversity score, or even that such a thing exists! How can there be so much discussion of diversity and so little understanding of what the word means? In this post I hope to give you a peek behind the curtain, and maybe shed some light on what diversity actually is and how it is measured.

This topic is of particular interest to me at present because momentum is building to make a study of diversity in business-decision making the subject of my doctoral dissertation in Business Administration. Specifically, I’m looking at how decision-making teams (such as boards of directors) can benefit from membership diversity, and what can go wrong.

Estimating Diversity

The dictionary definition of diversity is: “the condition of having or being composed of differing elements.”

So, before we can quantify the diversity of any group, we’ve got to identify what makes different elements different. This, by the way, is all basic set theory. In different contexts what we mean by “different” may vary. When we’re talking about group decision making in a business context, it gets pretty complicated.

A group may be subdivided, or “stratified” along various dimensions. For example, a team of ten people sitting around a table trying to figure out what to do next about, say, a new product could be subdivided in various ways. One way to stratify such a group is by age. You’d have so many individuals in their 20’s, so many might be in their 30’s, and so forth up to the oldest group being aged 50 or more. Another (perhaps more useful) way to subdivide them is by specialty. There may be so many software engineers, so many hardware engineers, so many marketers, and so forth. These days stratifying teams by gender, ethnicity, educational level or political persuasion could be important. What counts as diversity depends on what the team is trying to decide.

The moral of this story is that a team might score high in diversity along one dimension and very poorly along another. I’m not going to say any more about diversity’s multidimensional nature in this essay, however. We have other fish to fry today.

For now, let’s assume a one-dimensional diversity index. What we pick for a dimension makes little difference to the mathematics we use. Let’s just imagine a medium-sized group of, say, ten individuals and stratify them according to the color of tee-shirts they happen to be wearing at the moment.

What the color of their tee-shirts could possibly mean for the group’s decisions about new-product development I can’t imagine, and probably wouldn’t care anyway. It does, however, give us a way to stratify the sample. Let’s say their shirt colors fall out as in Table 1. So, we’ve got five categories of team members stratified by tee-shirt color.Table 1: Tee-Shirt Colors

NOTE: The next bit is mathematically rigorous enough to give most people nosebleeds. You can skip over it if you want to, as I’m going to follow it with a more useful quick-and-dirty estimation method.

The Gini–Simpson diversity index, which I consider to be the most appropriate for evaluating diversity of decision-making teams, has a range of zero to one, with zero being “everybody’s the same” and one being “everybody’s different.” We start by asking: “What is the probability that two members picked at random have the same color tee shirt?”

If you’ve taken my statistical analysis course, you’ll likely loathe remembering that the probability of picking two things from a stratified data set, and having them both fall into the same category is:

Equation 1

Where λ is the probability we want, N is the number of categories (in this case 5), and P is the probability that, given the first pick falling into a certain category (i) the second pick will be in the same category. The superscript 2 just indicates that we’re taking members two at a time. Basically P is the number of members in category i divided by the total number of members in all categories. Thus, if the first pick has a blue tee-shirt, then P is 3/10 = 0.3.

This probability is high when diversity is low, and low when diversity is high. The Gini-Simpson index makes more intuitive sense by simply subtracting that probability from unity (1.0) to get something that is low when diversity is low, and high when diversity is high.

NOTE: Here’s where we stop with the fancy math.

Guesstimating Diversity

Veteran business managers (at least those not suffering from pathological levels of OCD) realize that the vast majority of business decisions – in fact most decisions in general – are not made after extensive detailed mathematical analysis like what I presented in the previous section. In fact, humans have an amazing capacity for making rapid decisions based on what’s called “fuzzy logic.”

Fuzzy logic recognizes that in many situations, precise details may be difficult or impossible to obtain, and may not make a significant difference to the decision outcome, anyway. For example, deciding whether to step out to cross a street could be based on calculations using precise measurements of an oncoming car’s speed, distance, braking capacity, and the probability that the driver will detect your presence in time to apply the brakes to avoid hitting you.

But, it’s usually not.

If we had to make the decision by the detailed mathematical analysis of physical measurements, we’d hardly ever get across the street. We can’t judge speed or distance accurately enough, and have no idea whether the driver is paying attention. We don’t, in general, make these measurements, then apply detailed calculations using Gallilean Transformations to decide if now is a safe time to cross.

No, we have, with experience over time, developed a “gut feel” for whether it’s safe. We use fuzzy categories of “far” and “near,” and “slow” or “fast.” Even the terms “safe” and “unsafe” have imprecise meanings, gradually shifting from one to the other as conditions change. For example “safe to cross” means something quite different on a dry, sunny day in summertime, than when the pavement has a slippery sheen of ice.

Group decision making has a similar fuzzy component. We know that the decision team we’ve got is the decision team we’re going to use. It makes no difference whether it’s diversity score is 4.9 or 5.2, what we’ve got is what we’re going to use. Maybe we could make a half-percent improvement in the odds of making the optimal decision by spending six months recruiting and training a blind Hispanic woman with an MBA to join the team, but are we going to do it? Nope!

We’ll take our chances with the possibly sub-optimal decision made by the team we already have in place.

Hopefully we’re not trying to work out laws affecting 175 million American women with a team consisting of 500 old white guys, but, historically, that’s the team we’ve had. No wonder we’ve got so many sub-optimal laws!

Anyway, we don’t usually need to do the detailed Gini-Simpson Diversity Index calculation to guesstimate how diverse our decision committee is. Let’s look at some examples whose diversity indexes are easy to calculate. That will help us develop a “gut feel” for diversity that’ll be useful in most situations.

So, let’s assume we look around our conference room and see six identical white guys and six identical white women. It’s pretty easy to work out that the team’s diversity index is 0.5. The only way to stratify that group is by gender, and the two strata are the same size. If our first pick happens to be a woman, then there’s a 50:50 chance that the second pick will be a woman, too. One minus that probability (0.5) equals 0.5.

Now, let’s assume we still have twelve team members, but eleven of them are men and there’s only one token woman. If your first pick is the woman, the probability of picking a woman again is 1/12 = 0.8. (The Gini-Simpson formula lets you pick the same member twice.) If, on the other hand, your first pick is a man, the probability that the second pick will also be a man is 11/12 = 0.92. I plugged all this into an online Gini-Simpson-Index calculator (‘cause I’m lazy) and it returned a value of 26%. That’s a whole lot worse.

Let’s see what happens when we maximize diversity by making everyone different. That means we end up stratifying the members into twelve segments. After picking one member, the odds of the second pick being identical are 1/12 = 0.8 for every segment. The online calculator now gives us a diversity index of 91.7%. That’s a whole lot better!

What Could Possibly Go Wrong?

There are two main ways to screw up group diversity: group-think and group-toxicity. These are actually closely related group-dynamic phenomena. Both lower the effective diversity.

Group-think occurs when members are too accommodating. That is, when members strive too hard to reach consensus. They look around to see what other members want to do, and agree to it without trying to come up with their own alternatives. This produces sub-optimal decisions because the group fails to consider all possible alternatives.

Toxic group dynamics occurs when one or more members dominate the conversation either by being more vocal or more numerous. Members with more reticent personalities fail to speak up, thus denying the group their input. Whenever a member fails to speak up, they lower the group’s effective diversity.

A third phenomenon that messes up decision making for  high-diversity teams is that when individual members are too insistent that their ideas are the best, groups often fail to reach consensus at all. At that point more diversity makes reaching consensus harder. That’s the problem facing both houses of the U.S. Congress at the time of this writing.

These phenomena are present to some extent in every group discussion. It’s up to group leadership to suppress them. In the end, creating an effective decision-making team requires two elements: diversity in team membership, and effective team leadership. Membership diversity provides the raw material for effective team decision making. Effective leadership mediates group dynamics to make it possible to maximize the team’s effective diversity.

Stick to Your Knitting

Man knitting
Man in suit sticking to his knitting. Photo by fokusgood / Shutterstock

6 June 2019 – Once upon a time in an MBA school far, far away, I took a Marketing 101 class. The instructor, whose name I can no longer be sure of, had a number of sayings that proved insightful, bordering on the oracular. (That means they were generally really good advice.) One that he elevated to the level of a mantra was: “Stick to the knitting.”

Really successful companies of all sizes hew to this advice. There have been periods of history where fast-growing companies run by CEOs with spectacularly big egos have equally spectacularly honored this mantra in the breach. With more hubris than brains, they’ve managed to over-invest themselves out of business.

Today’s tech industry – especially the FAANG companies (Facebook, Amazon, Apple, Netflix and Google) – is particularly prone to this mistake. Here I hope to concentrate on what the mantra means, and what goes wrong when you ignore it.

Okay, “stick to your knitting” is based on the obvious assumption that every company has some core expertise. Amazon, for example, has expertise in building and operating an online catalog store. Facebook has expertise in running an online forum. Netflix operates a bang-up streaming service. Ford builds trucks. Lockheed Martin makes state-of-the-art military airplanes.

General Electric, which has core expertise in manufacturing industrial equipment, got into real trouble when it got the bright idea of starting a finance company to extend loans to its customers for purchases of its equipment.

Conglomeration

There is a business model, called the conglomerate that is based on explicitly ignoring the “knitting” mantra. It was especially popular in the 1960s. Corporate managers imagined that conglomerates could bring into play synergies that would make conglomerates more effective than single-business companies.

For a while there, this model seemed to be working. However, when business conditions began to change (specifically interest rates began to rise from an abnormally low level to more normal rates) their supposed advantages began melting like a birthday cake left outside in a rainstorm. These huge conglomerates began hemorrhaging money until vultures swooped in to pick them apart. Conglomerates are now a thing of the past.

There are companies, such as Berkshire Hathaway, whose core expertise is in evaluating and investing in other companies. Some of them are very successful, but that’s because they stick to their core expertise.

Berkshire Hathaway was originally a textile company that investor Warren Buffett took over when the textile industry was busy going overseas. As time went on, textiles became less important and, by 1985 this core part of the company was shut down. It had become a holding company for Buffett’s investments in other companies. It turns out that Buffett’s core competence is in handicapping companies for investment potential. That’s his knitting!

The difference between a holding company and a conglomerate is (and this is specifically my interpretation) a matter of integration. In a conglomerate, the different businesses are more-or-less integrated into the parent corporation. In a holding company, they are not.

Berkshire Hathaway is known for it’s insurance business, but if you want to buy, say, auto insurance from Berkshire Hathaway, you have to go to it’s Government Employees Insurance Company (GEICO) subsidiary. GEICO is a separate company that happens to be wholly owned by Berkshire Hathaway. That is, it has its own corporate headquarters and all the staff, fixtures and other resources needed to operate as an independent insurance company. It just happens to be owned, lock, stock and intellectual property by another corporate entity: Berkshire Hathaway.

GEICO’s core expertise is insurance. Berkshire Hathaway’s core expertise is finding good companies to invest in. Some are partially owned (e.g., 5.4% of Apple) some are wholly owned (e.g., Acme Brick).

Despite Berkshire Hathaway’s holding positions in both Apple and Acme Brick, if you ask Warren Buffet if Berkshire Hathaway is a computer company or a brick company, he’d undoubtedly say “no.” Berkshire Hathaway is a diversified holding company.

It’s business is owning other businesses.

To paraphrase James Coburn’s line from Stanley Donen’s 1963 film Charade: “[Mrs. Buffett] didn’t raise no stupid children!”

Why Giant Corporations?

All this giant corporation stuff stems from a dynamic I also learned about in MBA school: a company grows or it dies. I ran across this dynamic during a financial modeling class where we used computers to predict results of corporate decisions in lifelike conditions. Basically, what happens is that unless the company strives to its utmost to maintain growth, it starts to shrink and then all is lost. Feedback effects take over and it withers and dies.

Observations since then have convinced me this is some kind of natural law. It shows up in all kinds of natural systems. I used to think I understood why, but I’m not so sure anymore. It may have something to do with chaos, and we live in a chaotic universe. I resolve to study this in more detail – later.

But, anyway … .

Companies that embrace this mantra (You grow or you die.) grow until they reach some kind of external limit, then they stop growing and – in some fashion or other – die.

Sometimes (and paradigm examples abound) external limits don’t kick in before some company becomes very big, indeed. Standard Oil Company may be the poster child for this effect. Basically, the company grew to monopoly status and, in 1911 the U.S. Federal Government stepped in and, using the 1890 Sherman Anti-Trust Act, forced its breakup into 33 smaller oil companies, many of which still exist today as some of the world’s major oil companies (e.g., Mobil, Amoco, and Chevron). At the time of its breakup, Standard Oil had a market capitalization of just under $11B and was the third most valuable company in the U.S. Compare that to the U.S. GDP of roughly $34B at the time.

The problem with companies that big is that they generate tons of free cash. What to do with it?

There are three possibilities:

  1. You can reinvest it in your company;

  2. You can return it to your shareholders; or

  3. You can give it away.

Reinvesting free cash in your company is usually the first choice. I say it is the first choice because it is used at the earliest period of the company’s history – the period when growth is necessarily the only goal.

If done properly reinvestment can make your company grow bigger faster. You can reinvest by out-marketing your competition (by, say, making better advertisements) and gobbling up market share. You can also reinvest to make your company’s operations more effective or efficient. To grow, you also need to invest in adding production facilities.

At a later stage, your company is already growing fast and you’ve got state-of-the-art facilities, and you dominate your market. It’s time to do what your investors gave you their money for in the first place: return profits to them in the form of dividends. I kinda like that. It’s what the game’s all about, anyway.

Finally, most leaders of large companies recognize that having a lot of free cash laying around is an opportunity to do some good without (obviously) expecting a payback. I qualify this with the word “obviously” because on some level altruism does provide a return in some form.

Generally, companies engage in altruism (currently more often called “philanthropy”) to enhance their perception by the public. That’s useful when lawsuits rear their ugly heads or somebody in the organization screws up badly enough to invite public censure. Companies can enhance their reputations by supporting industry activities that do not directly enhance their profits.

So-called “growth companies,” however, get stuck in that early growth phase, and never transition to paying dividends. In the early days of the personal-computer revolution, tech companies prided themselves on being “growth stocks.” That is, investors gained vast wealth on paper as the companies’ stock prices went up, but couldn’t realized those gains (capital gains) unless they sold the stock. Or, as my father once did, by using the stock for collateral to borrow money.

In the end, wise investors eventually want their money back in the form of cash from dividends. For example, in the early 2000s, Microsoft and other technology companies were forced by their shareholders to start paying dividends for the first time.

What can go wrong

So, after all’s said and done, why’s my marketing professor’s mantra wise corporate governance?

To make money, especially the scads of money that corporations need to become really successful, you’ve gotta do something right. In fact, you gotta do something better than the other guys. When you know how to do something better than the other guys, that’s called expertise!

Companies, like people, have limitations. To imagine you don’t have limitations is hubris. To put hubris in perspective, recall that the ancients famously made it Lucifer’s cardinal sin. In fact, it was his only sin!

Folks who tell you that you can do anything are flat out conning your socks off.

If you’re lucky you can do one thing better than others. If you’re really lucky, you can do a few things better than others. If you try to do stuff outside your expertise, however, you’re gonna fail. A person can pick themselves up, dust themselves off, and try again – but don’t try to do the same thing again ‘cause you’ve already proved it’s outside your expertise. People can start over, but companies usually can’t.

One of my favorite sayings is:

Everything looks easy to someone who doesn’t know what they’re doing.

The rank amateur at some activity typically doesn’t know the complexities and pitfalls that an expert in the field has learned about through training and experience. That’s what we know as expertise. When anyone – or any company – wanders outside their field of expertise, they quickly fall foul of those complexities and pitfalls.

I don’t know how many times I’ve overheard some jamoke at an art opening say, “Oh, I could do that!”

Yeah? Then do it!

The artist has actually done it.

The same goes for some computer engineer who imagines that knowing how to program computers makes him (or her) smart, and because (s)he is so smart, (s)he could run, say, a magazine publishing house. How hard can it be?

Mark Zuckerberg is in the process of finding out.

Fed Reports on U.S. Economic Well-Being

Federal Reserve Building
The Federal Reserve released the results of its annual Survey of Household Economics and Decisionmaking for calendar year 2018 last week. Image by Thomas Barrat / Shutterstock

29 May 2019 – Last week (specifically 23 May 2019) the Federal Reserve Board released the results of its annual Survey of Household Economics and Decisionmaking for CY2018. I’ve done two things for readers of this blog. First, I downloaded a PDF copy of the report to make available free of charge on my website at cgmasi.com alongside last year’s report for comparison. Second, I’m publishing an edited extract of the report’s executive summary below.

The report describes the results of the sixth annual Survey of Household Economics and Decisionmaking (SHED). In October and November 2018, the latest SHED polled a self-selected sample of over 11,000 individuals via an online survey.

Along with the survey-results report, the Board published the complete anonymized data in CSV, SAS, STATA formats; as well as a supplement containing the complete SHED questionnaire and responses to all questions in the order asked. The survey continues to use subjective measures and self-assessments to supplement and enhance objective measures.

Overall Results

Survey respondents reported that most measures of economic well-being and financial resilience in 2018 are similar to or slightly better than in 2017. Many families have experienced substantial gains since the survey began in 2013, in line with the nation’s ongoing economic expansion during that period.

Even so, another year of economic expansion and the low national unemployment rates did little to narrow the persistent economic disparities by race, education, and geography. Many adults are financially vulnerable and would have difficulty handling an emergency expense as small as $400.

In addition to asking adults whether they are working, the survey asks if they want to work more and what impediments they see to them working.

Overall Economic Well-Being

A large majority of individuals report that, financially, they are doing okay or living comfortably, and overall economic well-being has improved substantially since the survey began in 2013

  • When asked about their finances, 75% of adults say they are either doing okay or living comfortably. This result in 2018 is similar to 2017 and is 12%age points higher than 2013.

  • Adults with a bachelor’s degree or higher are significantly more likely to be doing at least okay financially (87%) than those with a high school degree or less (64%).

  • Nearly 8 in 10 whites are at least doing okay financially in 2018 versus two-thirds of blacks and Hispanics. The gaps in economic well-being by race and ethnicity have persisted even as overall wellbeing has improved since 2013.

  • Fifty-six percent of adults say they are better off than their parents were at the same age and one fifth say they are worse off.

  • Nearly two-thirds of respondents rate their local economic conditions as “good” or “excellent,” with the rest rating conditions as “poor” or “only fair.” More than half of adults living in rural areas describe their local economy as good or excellent, compared to two-thirds of those living in urban areas.

Income

Changes in family income from month to month remain a source of financial strain for some individuals.

  • Three in 10 adults have family income that varies from month to month. One in 10 adults have struggled to pay their bills because of monthly changes in income. Those with less access to credit are much more likely to report financial hardship due to income volatility.

  • One in 10 adults, and over one-quarter of young adults under age 30, receive some form of financial support from someone living outside their home. This financial support is mainly between parents and adult children and is often to help with general expenses.

Employment

Most adults are working as much as they want to, an indicator of full employment; however, some remain unemployed or underemployed. Economic well-being is lower for those wanting to work more, those with unpredictable work schedules, and those who rely on gig activities as a main source of income.

  • One in 10 adults are not working and want to work, though many are not actively looking for work. Four percent of adults in the SHED are not working, want to work, and applied for a job in the prior 12 months. This is similar to the official unemployment rate of 3.8% in the fourth quarter of 2018.

  • Two in 10 adults are working but say they want to work more. Blacks, Hispanics, and those with less education are less likely to be satisfied with how much they are working.

  • Half of all employees received a raise or promotion in the prior year.

  • Unpredictable work schedules are associated with financial stress for some. One-quarter of employees have a varying work schedule, including 17% whose schedule varies based on their employer’s needs. One-third of workers who do not control their schedule are not doing okay financially, versus one-fifth of workers who set their schedule or have stable hours.

  • Three in 10 adults engaged in at least one gig activity in the prior month, with a median time spent on gig work of five hours. Perhaps surprisingly, little of this activity relies on technology: 3% of all adults say that they use a website or an app to arrange gig work.

  • Signs of financial fragility – such as difficulty handling an emergency expense – are slightly more common for those engaged in gig work, but markedly higher for those who do so as a main source of income.

Dealing with Unexpected Expenses

While self-reported ability to handle unexpected expenses has improved substantially since the survey began in 2013, a sizeable share of adults nonetheless say that they would have some difficulty with a modest unexpected expense.

  • If faced with an unexpected expense of $400, 61% of adults say they would cover it with cash, savings, or a credit card paid off at the next statement – a modest improvement from the prior year. Similar to the prior year, 27% would borrow or sell something to pay for the expense, and 12% would not be able to cover the expense at all.

  • Seventeen percent of adults are not able to pay all of their current month’s bills in full. Another 12% of adults would be unable to pay their current month’s bills if they also had an unexpected $400 expense that they had to pay.

  • One-fifth of adults had major, unexpected medical bills to pay in the prior year. One-fourth of adults skipped necessary medical care in 2018 because they were unable to afford the cost.

Banking and Credit

Most adults have a bank account and are able to obtain credit from mainstream sources. However, sub- stantial gaps in banking and credit services exist among minorities and those with low incomes.

  • Six percent of adults do not have a bank account. Fourteen percent of blacks and 11% of Hispanics are unbanked versus 4% of whites. Thirty-five percent of blacks and 23% of Hispanics have an account but also use alternative financial services, such as money orders and check cashing services, compared to 11% of whites.

  • More than one-fourth of blacks are not confident that a new credit card application would be approved if they applied—over twice the rate among whites.

  • Those who never carry a credit card balance are much more likely to say that they would pay an unexpected $400 expense with cash or its equivalent (88%) than those who carry a balance most or all of the time (40%) or who do not have a credit card (27%).

  • Thirteen percent of adults with a bank account had at least one problem accessing funds in their account in the prior year. Problems with a bank website or mobile app (7%) and delays in when funds were available to use (6%) are the most common problems. Those with volatile income and low savings are more likely to experience such problems.

Housing and Neighborhoods

Satisfaction with one’s housing and neighborhood is generally high, although notably less so in low-income communities. While 8 in 10 adults living in middle- and upper-income neighborhoods are satisfied with the overall quality of their community, 6 in 10 living in low- and moderate-income neighborhoods are satisfied.

  • People’s satisfaction with their housing does not vary much between more expensive and less expensive cities or between urban and rural areas.

  • Over half of renters needed a repair at some point in the prior year, and 15% of renters had moderate or substantial difficulty getting their landlord to complete the repair. Black and Hispanic renters are more likely than whites to have difficulties getting repairs done.

  • Three percent of non-homeowners were evicted, or moved because of the threat of eviction, in the prior two years. Evictions are slightly more common in urban areas than in rural areas.

Higher Education

Economic well-being rises with education, and most of those holding a post-secondary degree think that attending college paid off.

  • Two-thirds of graduates with a bachelor’s degree or more feel that their educational investment paid off financially, but 3 in 10 of those who started but did not complete a degree share this view.

  • Among young adults who attended college, more than twice as many Hispanics went to a for-profit institution as did whites. For young black attendees, this rate was five times the rate of whites.

  • Given what they know now, half of those who attended a private for-profit institution say that they would attend a different school if they had a chance to go back and make their college choices again. By comparison, about one-quarter of those who attended public or private not-for-profit institutions would want to attend a different school.

Student Loans and Other Education Debt

Over half of young adults who attended college took on some debt to pay for their education. Most borrowers are current on their payments or have successfully paid off their loans.

  • Among those making payments on their student loans, the typical monthly payment is between $200 and $299 per month.

  • Over one-fifth of borrowers who attended private for-profit institutions are behind on student loan payments, versus 8% who attended public institutions and 5% who attended private not-for-profit institutions.

Retirement

Many adults are struggling to save for retirement. Even among those who have some savings, people commonly lack financial knowledge and are uncomfortable making investment decisions.

  • Thirty-six percent of non-retired adults think that their retirement saving is on track, but one-quarter have no retirement savings or pension whatsoever. Among non-retired adults over the age of sixty, 45% believe that their retirement saving is on track.

  • Six in 10 non-retirees who hold self-directed retirement savings accounts, such as a 401(k) or IRA, have little or no comfort in managing their investments.

  • On average, people answer fewer than three out of five financial literacy questions correctly, with lower scores among those who are less comfortable managing their retirement savings.

The forgoing is an edited extract from the Report’s Executive Summary. A PDF version of the entire report is available on my website at cgmasi.com [ http://cgmasi.com ] along with a PDF version of the 2017 report, which was published in May of 2018 and based on a similar survey conducted in late 2017. Reports dating back to the first survey done in late 2013 are available from the Federal Reserve Board’s website linked to above.

Luddites’ Lament

Luddites attack
An owner of a factory defending his workshop against Luddites intent on destroying his mechanized looms between 1811-1816. Everett Historical/Shutterstock

27 March 2019 – A reader of last week’s column, in which I reported recent opinions voiced by a few automation experts at February’s Conference on the Future of Work held at at Stanford University, informed me of a chapter from Henry Hazlitt’s 1988 book Economics in One Lesson that Australian computer scientist Steven Shaw uploaded to his blog.

I’m not going to get into the tangled web of potential copyright infringement that Shaw’s posting of Hazlitt’s entire text opens up, I’ve just linked to the most convenient-to-read posting of that particular chapter. If you follow the link and want to buy the book, I’ve given you the appropriate link as well.

The chapter is of immense value apropos the question of whether automation generally reduces the need for human labor, or creates more opportunities for humans to gain useful employment. Specifically, it looks at the results of a number of historic events where Luddites excoriated technology developers for taking away jobs from humans only to have subsequent developments prove them spectacularly wrong.

Hazlitt’s classic book is, not surprisingly for a classic, well documented, authoritative, and extremely readable. I’m not going to pretend to provide an alternative here, but to summarize some of the chapter’s examples in the hope that you’ll be intrigued enough to seek out the original.

Luddism

Before getting on to the examples, let’s start by looking at the history of Luddism. It’s not a new story, really. It probably dates back to just after cave guys first thought of specialization of labor.

That is, sometime in the prehistoric past, some blokes were found to be especially good at doing some things, and the rest of the tribe came up with the idea of letting, say, the best potters make pots for the whole tribe, and everyone else rewarding them for a job well done by, say, giving them choice caribou parts for dinner.

Eventually, they had the best flint knappers make the arrowheads, the best fletchers put the arrowheads on the arrows, the best bowmakers make the bows, and so on. Division of labor into different jobs turned out to be so spectacularly successful that very few of us rugged individualists, who pretend to do everything for ourselves, are few and far between (and are largely kidding ourselves, anyway).

Since then, anyone who comes up with a great way to do anything more efficiently runs the risk of having the folks who spent years learning to do it the old way land on him (or her) like a ton of bricks.

It’s generally a lot easier to throw rocks to drive the innovator away than to adapt to the innovation.

Luddites in the early nineteenth century were organized bands of workers who violently resisted mechanization of factories during the late Industrial Revolution. Named for an imaginary character, Ned Ludd, who was supposedly an apprentice who smashed two stocking frames in 1779 and whose name had become emblematic of machine destroyers. The term “Luddite” has come to mean anyone fanatically opposed to deploying advanced technology.

Of course, like religious fundamentalists, they have to pick a point in time to separate “good” technology from the “bad.” Unlike religious fanatics, who generally pick publication of a certain text to be the dividing line, Luddites divide between the technology of their immediate past (with which they are familiar) and anything new or unfamiliar. Thus, it’s a continually moving target.

In either case, the dividing line is fundamentally arbitrary, so the emotion of their response is irrational. Irrationality typically carries a warranty of being entirely contrary to facts.

What Happens Next

Hazlitt points out, “The belief that machines cause unemployment, when held with any logical consistency, leads to preposterous conclusions.” He points out that on the second page of the first chapter of Adam Smith’s seminal book Wealth of Nations, Smith tells us that a workman unacquainted with the use of machinery employed in sewing-pin-making “could scarce make one pin a day, and certainly could not make twenty,” but with the use of the machinery he can make 4,800 pins a day. So, zero-sum game theory would indicate an immediate 99.98 percent unemployment rate in the pin-making industry of 1776.

Did that happen? No, because economics is not a zero-sum game. Sewing pins went from dear to cheap. Since they were now cheap, folks prized them less and discarded them more (when was the last time you bothered to straighten a bent pin?), and more folks could afford to buy them in the first place. That led to an increase in sewing-pin sales as well as sales of things like sewing-patterns and bulk fine fabric sold to amateur sewers, and more employment, not less.

Similar results obtained in the stocking industry when new stocking frames (the original having been invented William Lee in 1589, but denied a patent by Elizabeth I who feared its effects on employment in hand-knitting industries) were protested by Luddites as fast as they could be introduced. Before the end of the nineteenth century the stocking industry was employing at least a hundred men for every man it employed at the beginning of the century.

Another example Hazlitt presents from the Industrial Revolution happened in the cotton-spinning industry. He says: “Arkwright invented his cotton-spinning machinery in 1760. At that time it was estimated that there were in England 5,200 spinners using spinning wheels, and 2,700 weavers—in all, 7,900 persons engaged in the production of cotton textiles. The introduction of Arkwright’s invention was opposed on the ground that it threatened the livelihood of the workers, and the opposition had to be put down by force. Yet in 1787—twenty-seven years after the invention appeared—a parliamentary inquiry showed that the number of persons actually engaged in the spinning and weaving of cotton had risen from 7,900 to 320,000, an increase of 4,400 percent.”

As these examples indicate, improvements in manufacturing efficiency generally lead to reductions in manufacturing cost, which, when passed along to customers, reduces prices with concommitent increases in unit sales. This is the price elasticity of demand curve from Microeconomics 101. It is the reason economics is decidedly not a zero-sum game.

If we accept economics as not a zero-sum game, predicting what happens when automation makes it possible to produce more stuff with fewer workers becomes a chancy proposition. For example, many economists today blame flat productivity (the amount of stuff produced divided by the number of workers needed to produce it) for lack of wage gains in the face of low unemployment. If that is true, then anything that would help raise productivity (such as automation) should be welcome.

Long experience has taught us that economics is a positive-sum game. In the face of technological advancement, it behooves us to expect positive outcomes while taking measures to ensure that the concomitant economic gains get distributed fairly (whatever that means) throughout society. That is the take-home lesson from the social dislocations that accompanied the technological advancements of the Early Industrial Revolution.

Don’t Panic!

Panic button
Do not push the red button! Peter Hermes Furian/Shutterstock

20 March 2019 – The image at right visualizes something described in Douglas Adams’ Hitchiker’s Guide to the Galaxy. At one point, the main characters of that six-part “trilogy” found a big red button on the dashboard of a spaceship they were trying to steal that was marked “DO NOT PRESS THIS BUTTON!” Naturally, they pressed the button, and a new label popped up that said “DO NOT PRESS THIS BUTTON AGAIN!”

Eventually, they got the autopilot engaged only to find it was a stunt ship programmed to crash headlong into the nearest Sun as part of the light show for an interstellar rock band. The moral of this story is “Never push buttons marked ‘DO NOT PUSH THIS BUTTON.’”

Per the author: “It is said that despite its many glaring (and occasionally fatal) inaccuracies, the Hitchhiker’s Guide to the Galaxy itself has outsold the Encyclopedia Galactica because it is slightly cheaper, and because it has the words ‘DON’T PANIC’ in large, friendly letters on the cover.”

Despite these references to the Hitchhiker’s Guide to the Galaxy, this posting has nothing to do with that book, the series, or the guide it describes, except that I’ve borrowed the words from the Guide’s cover as a title. I did that because those words perfectly express the take-home lesson of Bill Snyder’s 11 March 2019 article in The Robot Report entitled “Fears of job-stealing robots are misplaced, say experts.”

Expert Opinions

Snyder’s article reports opinions expressed at the the Conference on the Future of Work at Stanford University last month. It’s a topic I’ve shot my word processor off about on numerous occasions in this space, so I thought it would be appropriate to report others’ views as well. First, I’ll present material from Snyder’s article, then I’ll wrap up with my take on the subject.

“Robots aren’t coming for your job,” Snyder says, “but it’s easy to make misleading assumptions about the kinds of jobs that are in danger of becoming obsolete.”

“Most jobs are more complex than [many people] realize,” said Hal Varian, Google’s chief economist.

David Autor, professor of economics at the Massachusetts Institute of Technology points out that education is a big determinant of how developing trends affect workers: “It’s a great time to be young and educated, but there’s no clear land of opportunity for adults who haven’t been to college.”

“When predicting future labor market outcomes, it is important to consider both sides of the supply-and-demand equation,” said Varian, “demographic trends that point to a substantial decrease in the supply of labor are potentially larger in magnitude.”

His research indicates that shrinkage of the labor supply due to demographic trends is 53% greater than shrinkage of demand for labor due to automation. That means, while relatively fewer jobs are available, there are a lot fewer workers available to do them. The result is the prospect of a continued labor shortage.

At the same time, Snyder reports that “[The] most popular discussion around technology focuses on factors that decrease demand for labor by replacing workers with machines.”

In other words, fears that robots will displace humans for existing jobs miss the point. Robots, instead, are taking over jobs for which there aren’t enough humans to do them.

Another effect is the fact that what people think of as “jobs” are actually made up of many “tasks,” and it’s tasks that get automated, not entire jobs. Some tasks are amenable to automation while others aren’t.

“Consider the job of a gardener,” Snyder suggests as an example. “Gardeners have to mow and water a lawn, prune rose bushes, rake leaves, eradicate pests, and perform a variety of other chores.”

Some of these tasks, like mowing and watering, can easily be automated. Pruning rose bushes, not so much!

Snyder points to news reports of a hotel in Nagasaki, Japan being forced to “fire” robot receptionists and room attendants that proved to be incompetent.

There’s a scene in the 1997 film The Fifth Element where a supporting character tries to converse with a robot bartender about another character. He says: “She’s so vulnerable – so human. Do you you know what I mean?” The robot shakes its head, “No.”

Sometimes people, even misanthropes, would prefer to interact with another human than with a drink-dispensing machine.

“Jobs,” Varian points out, “unlike repetitive tasks, tend not to disappear. In 1950, the U.S. Census Bureau listed 250 separate jobs. Since then, the only one to be completely eliminated is that of elevator operator.”

“Excessive automation at Tesla was a mistake,” founder Elon Musk mea culpa-ed last year “Humans are underrated.”

Another trend Snyder points out is that automation-ready jobs, such as assembly-line factory workers, have already largely disappeared from America. “The 10 most common occupations in the U.S.,” he says, “include such jobs as retail salespersons, nurses, waiters, and other service-focused work. Notably, traditional occupations, such as factory and other blue-collar work, no longer even make the list.

Again, robots are mainly taking over tasks that humans are not available to do.

The final trend that Snyder presents, is the stark fact that birthrates in developed nations are declining – in some cases precipitously. “The aging of the baby boom generation creates demand for service jobs,” Varian points out, “but leaves fewer workers actively contributing labor to the economy.”

Those “service jobs” are just the ones that require a human touch, so they’re much harder to automate successfully.

My Inexpert Opinion

I’ve been trying, not entirely successfully, to figure out what role robots will actually have vis-a-vis humans in the future. I think there will be a few macroscopic trends. And, the macroscopic trends should be the easiest to spot ‘cause they’re, well, macroscopic. That means bigger. So, there easier to see. See?

As early as 2010, I worked out one important difference between robots and humans that I expounded in my novel Vengeance is Mine! Specifically, humans have a wider view of the Universe and have more of an emotional stake in it.

“For example,” I had one of my main characters pontificate at a cocktail party, “that tall blonde over there is an archaeologist. She uses ROVs – remotely operated vehicles – to map underwater shipwreck sites. So, she cares about what she sees and finds. We program the ROVs with sophisticated navigational software that allows her to concentrate on what she’s looking at, rather than the details of piloting the vehicle, but she’s in constant communication with it because she cares what it does. It doesn’t.”

More recently, I got a clearer image of this relationship and it’s so obvious that we tend to overlook it. I certainly missed it for decades.

It hit me like a brick when I saw a video of an autonomous robot marine-trash collector. This device is a small autonomous surface vessel with a big “mouth” that glides around seeking out and gobbling up discarded water bottles, plastic bags, bits of styrofoam, and other unwanted jetsam clogging up waterways.

The first question that popped into my mind was “who’s going to own the thing?” I mean, somebody has to want it, then buy it, then put it to work. I’m sure it could be made to automatically regurgitate the junk it collects into trash bags that it drops off at some collection point, but some human or humans have to make sure the trash bags get collected and disposed of. Somebody has to ensure that the robot has a charging system to keep its batteries recharged. Somebody has to fix it when parts wear out, and somebody has to take responsibility if it becomes a navigation hazard. Should that happen, the Coast Guard is going to want to scoop it up and hand its bedraggled carcass to some human owner along with a citation.

So, on a very important level, the biggest thing robots need from humans is ownership. Humans own robots, not the other way around. Without a human owner, an orphan robot is a pile of junk left by the side of the road!