Next-generation, self-healing supply networks will feature robustness against supply interruptions. Image by urbans/Shutterstock
15 April 2020 – Business organizations have always been about supply networks, even before business leaders consciously thought in those terms. During the first half of the 20th century, the largest firms were organized hierarchically, like the monarchies that ruled the largest nations. Those firms, some of which had already been international in scope, like the East India Trading Company of previous centuries, thought in monopolistic terms. Even as late as the early 1960s, when I was in high school, management theory ran to vertical and horizontal monopolies. As globalization grew, the vertical monopoly model transformed into multinational enterprises (MNEs) consisted of supply chains of smaller companies supplying subassemblies to larger companies that ultimately distributed branded products (such as the ubiquitous Apple iPhone) to consumers worldwide.
The current pandemic of COVID-19 disease, has shattered that model. Supply chains, just as any other chains, proved only as strong as their weakest link. Requirements for social distancing to control the contagion made it impossible to continue the intense assembly-line-production operations that powered industrialization in the early 20th century. To go forward with reopening the world economy, we need a new model.
Luckily, although luck had far less to do with it than innovative thinking, that model came together in the 1960s and 1970s, and is already present in the systems thinking behind the supply-chain model. The monolithic, hierarchically organized companies that dominated global MNEs in the first half of the 20th century have already morphed into a patchwork of interconnected firms that powered the global economies of the first quarter of the 21st century. That is, up until the end of calendar-year 2019, when the COVID-19 pandemic trashed them. That model is the systems organization model.
The systems-organization model consists of separate functional teams, which in the large-company business world are independent firms, cooperating to produce consumer-ready products. Each firm has its own special expertise in conducting some part of the process, which it does as well or better than its competitors. This is the comparative-advantage concept outlined by David Ricardo over 200 years ago that was, itself, based on ideas that had been vaguely floating around since the ancient Greek thinker Hesiod wrote what has been called the first book about economics, Works and Days, somewhere in the middle of the first millennium BCE.
Each of those independent firms does its little part of the process on stuff they get from other firms upstream in the production flow, and passes their output on downstream to the next firm in the flow. The idea of a supply chain arises from thinking about what happens to an individual product. A given TV set, for example, starts with raw materials that are processed in piecemeal fashion by different firms as it journeys along its own particular path to become, say, a Sony TV shipped, ultimately, to an individual consumer. Along the way, the thinking goes, each step in the process ideally is done by the firm with the best comparative advantage for performing that operation. Hence, the systems model for an MNE that produces TVs is a chain of firms that each do their bit of the process better than anyone else. Of course, that leaves the entire MNE at risk from any exogenous force, from an earthquake to a pandemic, which distrupts operations at any of the firms in the chain. What was originally the firm with the Ricardoan comparative advantage for doing their part, suddenly becomes a hole that breaks the entire chain.
Systems theory, however, provides an answer: the supply network. The difference between a chain and a network is its interconnectedness. In network parlance, the firms that conduct steps in the process are called nodes, and the interconnections between nodes are called links. In a supply chain, nodes have only one input link from an upstream firm, and only one output link to the next firm in the chain. In a wider network, each node has multiple links into the node, and multiple links out of the node. With that kind of structure, if one node fails, the flow of products can bypass that node and keep feeding the next node(s) downstream. This is the essence of a self-healing network. Whereas a supply chain is brittle in that any failure anywhere breaks the whole system down, a self-healing network is robust in that it single-point failures do not take down the entire system, but cause flow paths to adjust to keep the entire system operating.
The idea of providing alternative pathways via multiple linkages flies in the face of Ricardo’s comparative-advantage concept. Ricardo’s idea was that in a collection of competitors producing the same or similar goods, the one firm that produces the best product at the lowest cost drives all the others out of business. Requiring simultaneous use of multiple suppliers means not allowing the firm with the best comparative advantage to drive the others out of business. By accepting slightly inferior value from alternative suppliers into the supply mix, the network accepts slightly inferior value in the final product while ensuring that, when the best supplier fails for any reason, the second-best supplier is there, on line, ready to go, to take up the slack. It deliberately sacrifices its ultimate comparative advantage as the pinnacle of potential suppliers in order to lower the risk of having its supply chain disrupted in the future.
This, itself, is a risky strategy. This kind of network cannot survive as a subnet in a larger, brittle supply chain. If its suppliers and, especially, customers embrace the Ricardo model, it could be in big trouble. First of all, a highly interconnected subnet embedded in a long supply chain is still subject to disruptions anywhere else in the rest of the chain. Second, if suppliers and customers have an alternative path through a firm with better comparative advantage than the subnet, Ricardo’s theory suggests that the subnet is what will be driven out of business. For this alternative strategy to work, the entire industry, from suppliers to customers, has to embrace it. This proviso, of course, is why we’ve been left with brittle supply chains decimated by disruptions due to the COVID-19 pandemic. The alternative is adopting a different, more robust paradigm for global supply networks en masse.
Semi-logarithmic plot of historic record of Dow Jones Industrial Average closing values from 1900-2020 plotted against an increasing exponential function to show chaotic oscillations.
18 March 2020 –Equities markets are not a zero-sum game (Fama, 1970). They are specifically designed to provide investors with a means of participating in companies’ business performance either directly through regular cash dividends, or indirectly through a secular increase in the market prices of the companies’ stock. The efficient market hypothesis (EMH), which postulates that stock prices reflect all available information, specifically addresses the stock-price-appreciation channel. EMH has three forms (Klock, & Bacon, 2014):
Weak-form EMH refers specifically to predictions based on past-price information;
Semi-strong form EMH includes use of all publicly available information;
Strong-form EMH includes all information, including private, company-confidential information.
This essay examines equities-market efficiency from the point of view of a model based on chaos theory (Gleick, 2008). The model envisions market-price movements as chaotic fluctuations around an equilibrium value determined by strong-form market efficiency (Chauhan, Chaturvedula, & Iyer, 2014). The next section shows how equities markets work as dynamical systems, and presents evidence that they are also chaotic. The third section describes how dynamical systems work in general. The fourth section shows how dynamical systems become chaotic. The conclusion ties up the argument’s various threads.
Stock-Market Dynamism
Once a stock is sold to the public, it can be traded between various investors at a strike price that is agreed upon ad hoc between buyers and sellers in a secondary market (Hayek, 1945). When one investor decides to sell stock in a given company, it increases the supply of that stock, exerting downward pressure on the strike price. Conversely, when another investor decides to buy that stock, it increases the demand, driving the strike price up. Interestingly, consummating the transaction decreases both supply and demand, and thus has no effect on the strike price. It is the intention to buy or sell the stock that affects the price. The market price is the strike price of the last transaction completed.
Successful firms grow in value over time, which is reflected in secular growth of the market price of their stocks. So, there exists an arbitrage strategy that has a high probability of a significant return: buy and hold. That is, buy equity in a well-run company, and hold it for a significant period of time, then sell. That, of course, is not what is meant by market efficiency (Chauhan, et al, 2014). Efficient market theory specifically concerns itself with returns in excess of such market returns (Fama, 1970).
Of course, if all investors were assured the market price would rise, no owners would be willing to sell, no transactions could occur, and the market would collapse. Similarly, if all investors were assured that the stock’s market price would fall, owners would be anxious to sell, but nobody would be willing to buy. Again, no transactions could occur, and the market would, again, collapse. Markets therefore actually work because of the dynamic tension created by uncertainty as to whether any given stock’s market price will rise or fall in the near future, making equities markets dynamical systems that move constantly (Hayek, 1945).
Fama (1970) concluded that on time scales longer than a day, the EMH appears to work. He found, however, evidence that on shorter time scales it was possible to use past-price information to obtain returns in excess of market returns, violating even weak-form efficiency. He concluded, however, that returns available on such short time scales were insufficient to cover transaction costs, upholding weak-form EMH. Technological improvements since 1970 have, however, drastically reduced costs for high volumes of very-short-timescale transactions, making high-frequency trading profitable (Baron, Brogaard, Hagströmer, & Kirilenko, 2019). Such short-time predictability and long-time unpredictability is a case of sensitive dependence on initial conditions, which Edward Lorentz discovered in 1961 to be one of the hallmarks of chaos (Gleick, 2008). Since 1970, considerable work has been published applying the science of chaotic systems to markets, especially the forex market (Bhattacharya, Bhattacharya, & Roychoudhury, 2017), which operates nearly identically to equities markets.
Dynamic Attraction
Chaos is a property of dynamical systems. Dynamical-systems theory generally concerns itself with the behavior of some quantitative variable representing the motion of a system in a phase space. In the case of a one-dimensional variable, such as the market price of a stock, the phase space is two dimensional, with the variable’s instantaneous value plotted along one axis, and its rate of change plotted along the other (Strogatz, 2015). At any given time, the variable’s value and rate of change determine the location in phase space of a phase point representing the system’s instantaneous state of motion. Over time, the phase point traces out a path, or trajectory, through phase space.
As a simple example illustrating dynamical-system features, take an unbalanced bicycle wheel rotating in a vertical plane (Strogatz, 2015). This system has only one moving part, the wheel. The stable equilibrium position for that system is to have the unbalanced weight hanging down directly below the axle. If the wheel is set rotating, the wheel’s speed increases as the weight approaches its equilibrium position, and decreases as it moves away. If the energy of motion is not too large, the wheel’s speed decreases until it stops, then starts rotating back toward the fixed equilibrium point, then slows again, stops, then rotates back. In the absence of friction, this oscillating motion continues ad infinitum. In phase space, the phase point’s trajectory is an elliptical orbit centered on an attractor located at the unbalanced weight’s equilibrium position and zero velocity. The ellipse’s size (semi-major axis) depends on the amount of energy in the motion. The more energy, the larger the orbit.
If, on the other hand, the wheel’s motion has too much energy, it carries the unbalanced weight over the top (Strogatz, 2015). The wheel then continues rotating in one direction, and the oscillation stops. In phase space, the phase point appears outside some elliptical boundary defined by how much energy it takes to drive the unbalanced weight over the top. That elliptical boundary defines the attractor’s basin of attraction.
Chaotic Attractors
To illustrate how a dynamic system can become chaotic requires a slightly more complicated example. The pitch-control system in an aircraft is particularly apropos equities markets. This system is a feedback control system with two moving parts: the pilot and aircraft (Efremov, Rodchenko, & Boris, 1996). In that system, the oscillation arises from a difference in the speed at which the aircraft reacts to control inputs, and the speed at which the pilot reacts in an effort to correct unintended aircraft movements. The pilot’s response typically lags the aircraft’s movement by a more-or-less fixed time. In such a case, there is always an oscillation frequency at which that time lag equals one oscillation period (i.e., time to complete one cycle). The aircraft’s nose then bobs up and down at that frequency, giving the aircraft a porpoising motion. Should the pilot try to control the porpoising, the oscillation only grows larger because the response still lags the motion by the same amount. This is called pilot induced oscillation (PIO), and it is a major nuisance for all feedback control systems.
PIO relates to stock-market behavior because there is always a lag between market-price movement and any given investor’s reaction to set a price based on it (Baron, Brogaard, Hagströmer, & Kirilenko, 2019). The time lag between intention and consummation of a trade will necessarily represent the period of some PIO-like oscillation. The fact that at any given time there are multiple investors (up to many thousands) driving market-price fluctuations at their own individual oscillation frequencies, determined by their individual reaction-time lags, makes the overall market a chaotic system with many closely spaced oscillation frequencies superposed on each other (Gleick, 2008).
This creates the possibility that a sophisticated arbitrageur may analyze the frequency spectrum of market fluctuations to find an oscillation pattern large enough (because it represents a large enough group of investors) and persistent enough to provide an opportunity for above-market returns using a contrarian strategy (Klock, & Bacon, 2014). Of course, applying the contrarian strategy damps the oscillation. If enough investors apply it, the oscillation disappears, restoring weak-form efficiency.
Conclusion
Basic market theory based on Hayek’s (1945) description assumes there is an equilibrium market price for any given product, which in the equity-market case is a company’s stock (Fama, 1970). Fundamental (i.e., strong-form efficient) considerations determine this equilibrium market price (Chauhan, et al, 2014). The equilibrium price identifies with the attractor of a chaotic system (Gleick, 2008; Strogatz, 2015). Multiple sources showing market fluctuations’ sensitive dependence on initial conditions serve to bolster this identification (Fama, 1970; Baron, Brogaard, et al, 2019; Bhattacharya, et al, 2017). PIO-like oscillations among a large group of investors provide a source for such market fluctuations (Efremov, et al, 1996).
References
Baron, M., Brogaard, J., Hagströmer, B., & Kirilenko, A. (2019). Risk and return in high-frequency trading. Journal of Financial & Quantitative Analysis, 54(3), 993–1024.
Bhattacharya, S. N., Bhattacharya, M., & Roychoudhury, B. (2017). Behavior of the foreign exchange rates of BRICs: Is it chaotic? Journal of Prediction Markets, 11(2), 1–18.
Chauhan, Y., Chaturvedula, C., & Iyer, V. (2014). Insider trading, market efficiency, and regulation. A literature review. Review of Finance & Banking, 6(1), 7–14.
Efremov, A. V., Rodchenko, V. V., & Boris, S. (1996). Investigation of Pilot Induced Oscillation Tendency and Prediction Criteria Development (No. SPC-94-4028). Moscow Inst of Aviation Technology (USSR).
Fama, E. (1970). Efficient capital markets: A review of theory and empirical work. The Journal of Finance, 25(2), 383-417.
Farazmand, A. (2003). Chaos and transformation theories: A theoretical analysis with implications for organization theory and public management. Public Organization Review, 3(4), 339-372.
Gleick, J. (2008). Chaos: Making a new science. New York, NY; Penguin Group.
Hayek, F. A. (1945). The use of knowledge in society. American Economic Review, 35(4), 519–530.
Klock, S. A., & Bacon, F. W. (2014). The January effect: A test of market efficiency. Journal of Business & Behavioral Sciences, 26(3), 32–42.
Strogatz, S. H. (2018). Nonlinear dynamics and chaos. Boca Raton, FL: CRC Press.
Money exists as metadata representing equal amounts of credit and debit.
26 February 2020 – This essay is a transcription of a paper I wrote last week as part of my studies for a Doctor of Business Administration (DBA) at Keiser University.
Developing a theory that quantitatively determines the rate of exchange between two fiat currencies has been a problem since the Song dynasty, when China’s Jurchen neighbors to the north figured out that they could emulate China’s Tang-dynasty innovation of printing fiat money on paper (Onge, 2017). With two currencies to exchange, some exchange rate was needed. This essay looks to Song-Dynasty economic history to find reasons why foreign exchange (forex) rates are so notoriously hard to predict. The analytical portion starts from the proposition that money itself is neutral (Patinkin & Steiger, 1989), and incorporates recently introduced ideas about money (de Soto, 2000; Masi, 2019), and concludes in favor of the interest rate approach for forex-rate prediction (Scott Hacker, Karlsson, & Månsson, 2012).
Song-Dynasty Economics
After the introduction of paper money, the Song Chinese quickly ran into the problem of inflation due to activities of rent seekers (Onge, 2017). Rent-seeking is an economics term that refers to attempts to garner income from non-productive activities, and has been around since at least the early days of agriculture (West, 2008). The Greek poet Hesiod complained about it in what has been called the first economics text, Works and Days, in which he said, “It is from work that men are rich in flocks and wealthy … if you work, it will readily come about that a workshy man will envy you as you become wealthy” (p. 46).
Repeated catastrophes arose for the Song Chinese after socialist economist Wang Anshi, prime minister from 1069 to 1076, taught officials that they could float government expenditures by simply cranking up their printing presses to flood the economy with fiat currency (Onge, 2017). Inflation exploded while productivity collapsed. The Jurchens took advantage of the situation by conquering the northern part of China’s empire. After they, too, destroyed their economy by succumbing to Wang’s bad advice, the Mongols came from the west to take over everything and confiscate the remaining wealth of the former Chinese Empire to fund their conquest of Eurasia.
Neutrality of Money
The proposition that money is neutral comes from a comment by John Stuart Mill, who, in 1871, wrote that “The relations of commodities to one another remain unaltered by money” (as cited in Patinkin & Steiger, 1989, p. 239). In other words, if a herdsman pays a farmer 50 cows as bride price for one of the farmer’s daughters, it makes no difference whether those 50 cows are worth 100 gold shekels, or 1,000, the wife is still worth 50 cows! One must always keep this proposition in mind when thinking about foreign exchange rates, and money in general. (Apologies for using a misogynistic example treating women as property, but we’re trying to drive home the difference between a thing and its monetary value.)
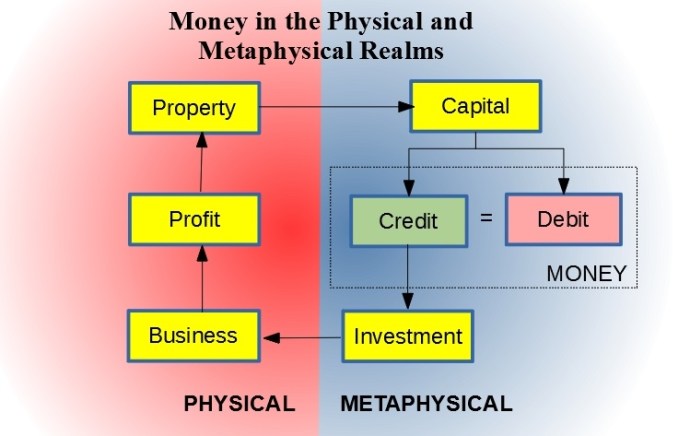
Another concept to keep in mind is Hernando de Soto’s (2000) epiphany that a house is just a shelter from the weather until it is secured by a property title. He envisioned that such things as titles inhabit what amounts to a separate universe parallel to the physical universe where the house resides. Borrowing a term from philosophy, one might call this a metaphysical universe made up of metadata that describes objects in the physical universe. de Soto’s idea was that existence of the property-title metadata turns the house into wealth that can become capital through the agency of beneficial ownership.
If one has beneficial ownership of a property title, one can encumber it by, for example, using it to secure a loan. One can then invest the funds derived from that loan into increased productive capacity of a business–back in the physical universe. Thus, the physical house is just an object, whereas the property title is capital (de Soto, 2000). It is the metaphysical capital that is transferable, not the physical property. In the transaction between the farmer and the herdsman above, what occurred was a swap between the two parties of de-Sotoan capital derived from beneficial ownership of the cattle and of the daughter, and it happened in the metaphysical universe.
What Is Money, Really?
Much of the confusion about forex rates arises from conflating capital and money. Masi (2019) speculated that money in circulation (e.g., M1) captures only half of what money really is. Borrowing concepts from both physics and double-entry bookkeeping, he equated money with a two-part conserved quantity he referred to as credit/debit. (Note that here the words “credit” and “debit” are not used strictly according to their bookkeeping definitions.) Credit arises in tandem with creation of an equal amount of debit. Thus, the net amount of money (equaling credit-minus-debit) is always the same: zero. A homeowner raising funds through a home-equity line of credit (HELOC) does not affect his or her total wealth. The transaction creates funds (credit) and debt (debit) in equal amounts. Similarly, a government putting money into circulation, whether by printing pieces of paper, or by making entries in a digital ledger, automatically increases the national debt.
Capital, on the other hand, arises, as de Soto (2000) explained, as metadata associated with property. The confusion comes from the fact that both capital and money are necessarily measured in the same units. While capital can increase through, say, building a house, or it can decrease by, for example, burning a house down, the amount of money (as credit/debit) can never change. It’s always a net zero.
The figure above shows how de Soto’s (2000) and Masi’s (2019) ideas combine. The cycle begins on the physical side with beneficial ownership of some property. On the metaphysical side, that beneficial ownership is represented by capital (i.e., property title). That capital can be used to secure a loan, which creates credit and debit in equal amounts. The beneficial owner is then free to invest the credit in beneficial ownership of a productive business back on the physical side. The business generates profits (e.g., inventory) that the owner retains as an increase in property.
The debit that was created along the way stays on the metaphysical side as an encumbrance on the total capital. The system is limited by the quantity of capital that can be encumbered, which limits the credit that can be created to fund continuing operations. The system grows through productivity of the business, which increases the property that can be represented by new capital, which can be encumbered by additional credit/debit creation, which can then fund more investment, and so forth. Note that the figure ignores, for simplicity, ongoing investment required to maintain the productive assets, and interest payments to service the debt.
Wang’s mismanagement strategy amounted to deficit spending–using a printing press to create credit/debit faster than the economy can generate profit to be turned into an increasing stock of capital (Onge, 2017). Eventually, the debt level rises to encumber the entire capital supply, at which point no new credit/debit can be created. Continued running of Wang’s printing press merely creates more fiat money to chase the same amount of goods: inflation. Thus, inflation arises from having the ratio of money creation divided by capital creation greater than one.
In Song China, investment collapsed due to emphasis on rent seeking, followed by collapsing productivity (Onge, 2017). Hyperinflation set in as the government cranked the printing presses just to cover national-debt service. Finally, hungry outsiders, seeing the situation, swooped in to seize the remaining productive assets. First it was the Jurchens, then the Mongols.
Forex and Hyperinflation
The Song Chinese quickly saw Wang’s mismanagement at work, and kicked him out of office (Onge, 2017). They, however, failed to correct the practices he’d introduced. Onge (2017) pointed out that China’s GDP per person at the start of the Song dynasty was greater than that of 21st-century Great Britain. Under Wang’s policies, decline set in around 1070–80, and GDP per person had fallen by 23% by 1120. Population growth changed to decline. Productivity cratered. Inflation turned to hyperinflation. The Jurchen, without the burden of Wang’s teachings, were slower to inflate their currency.
As Chinese inflation increased relative to that of the Jurchen, exchange rates between Jurchen and Chinese currencies changed rapidly. The Jurchen fiat currency became stronger relative to that of the Chinese. This tale illustrates how changes in forex rates follow relative inflation between currencies, and argues for using the interest rate approach to predict future equilibrium forex rates (Scott Hacker, et al., 2012).
Conclusion
Forex rates are free to fluctuate because money is neutral (Patinkin & Steiger, 1989). Viewing money as a conserved two-fluid metaphysical quantity (Masi, 2019) shows how a country’s supply of de-Sotoan capital constrains the money supply, and shows how an economy grows through profits from productive businesses (de Soto, 2000). It also explains inflation as an attempt to increase the money supply faster than the capital supply can grow. The mismatch of relative inflation affects equilibrium forex rates by increasing strength of one currency relative to another, and argues for the interest-rate approach to forex theory (Scott Hacker, et al., 2012).
References
de Soto, H. (2000). The mystery of capital. New York, NY: Basic Books.
Masi, C. G. (2019, June 19). The Fluidity of Money. [Web log post]. Retrieved from http://cgmblog.com/2019/06/19/the-fluidity-of-money/
Onge, P. S. T. (2017). How paper money led to the Mongol conquest: Money and the collapse of Song China. The Independent Review, 22(2), 223-243.
Patinkin, D., & Steiger, O. (1989). In search of the “veil of money” and the “neutrality of money”: A note on the origin of terms. Scandinavian Journal of Economics, 91(1), 131.
Scott Hacker, R., Karlsson, H. K., & Månsson, K. (2012). The relationship between exchange rates and interest rate differentials: A wavelet approach. World Economy, 35(9), 1162–1185.
West, M. L. [Ed.] (2008). Hesiod: Theogony and works and days. Oxford, UK; Oxford University Press.
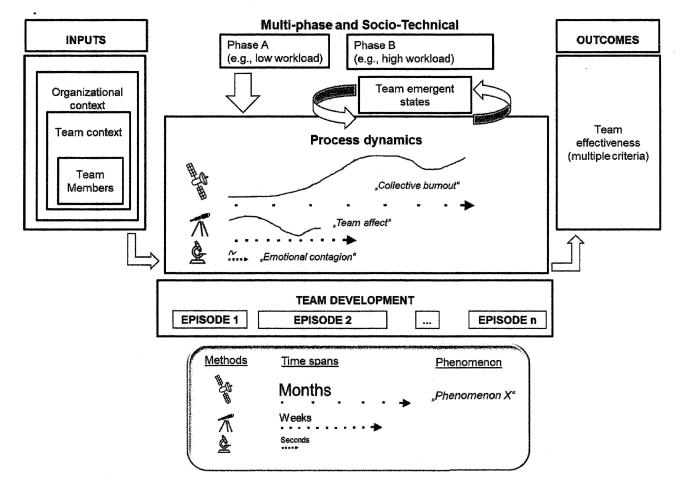
A temporal framework to understand team dynamics with high resolution. Image by Klonek et al
30 October 2019 – The essay below was posted to the Keiser University DBA 710 Week 8 Discussion Forum. It is reproduced here in the hope that readers of this blog will find this peek into state-of-the-art management research interesting.
This posting is a bit off topic for Week 8, but it reviews a paper that didn’t cross my desk in time to be included in last week’s discussions, where it would have been more appropriate. In fact, the copy of the paper I received was a manuscript version of a paper accepted by the journal Organizational Psychology Review that is at the printer now.
The paper, written by an Australian-German team, covers recent developments in measuring variables apropos management of decision teams in various situations (Klonek, Gerpott, Lehmann-Willenbrock & Parker, in press). As we saw last week, there is a lot of work to be done on metrology of leadership and management variables. The two main metrology-tool classifications are case studies (Pettigrew, 1990) and surveys (Osei-Kyei & Chan, 2018). Both involve time lags that make capturing data in real time and assuring its freedom from bias impossible (Klonek, Gerpott, Lehmann-Willenbrock & Parker, in press). Decision teams, however, present a dynamic environment where decision-making processes evolve over time (Lu, Gao & Szymanski, 2019). To adequately study such processes requires making time resolved measurements quickly enough to follow these dynamic changes.
Recent technological advances change that situation. Wireless sensor systems backed by advanced data-acquisition software make in possible to unobtrusively monitor team members’ activities in real time (Klonek, Gerpott, Lehmann-Willenbrock & Parker, in press). The paper describes how management scholars can use these tools to capture useful information for making and testing management theories. It provides a step-by-step breakdown of the methodology, including determining the appropriate time-resolution target, choosing among available metrology tools, capturing data, organizing data, and interpreting data. It covers working on time scales from milliseconds to months, and mixed time scales. Altogether, the paper provides invaluable information for anyone intending to link management theory and management practice in an empirical way (Bartunek, 2011).
References
Bartunek, J. M. (2011). What has happened to Mode 2? British Journal of Management, 22(3), 555–558.
Klonek, F.E., Gerpott, F., Lehmann-Willenbrock, N., & Parker, S. (in press). Time to go wild: How to conceptualize and measure process dynamics in real teams with high resolution? Organizational Psychology Review.
Lu, X., Gao, J. & Szymanski, B. (2019) The evolution of polarization in the legislative branch of government. Journal of the Royal Society Interface, 16: 20190010.
Osei-Kyei, R., & Chan, A. (2018). Evaluating the project success index of public-private partnership projects in Hong Kong. Construction Innovation, 18(3), 371-391.
Pettigrew, A. M. (1990). Longitudinal Field Research on Change: Theory and Practice. Organization Science, 1(3), 267–292.
External information about team attributes, group dynamics and organizational goals ultimately determine project success.
4 September 2019 – I’m in the early stages of a long-term research project for my Doctor of Business Administration (DBA) degree. Hopefully, this research will provide me with a dissertation project, but I don’t have to decide that for about a year. And, in the chaotic Universe in which we live a lot can, and will, happen in a year.
I might even learn something!
And, after learning something, I might end up changing the direction of my research. Then again, I might not. To again (as I did last week ) quote Winnie the Pooh: “You never can tell with bees!”
No, this is not an appropriate forum for publishing academic research results. For that we need peer-reviewed scholarly journals. There are lots of them out there, and I plan on using them. Actually, if I’m gonna get the degree, I’m gonna have to use them!
This is, however, an appropriate forum for summarizing some of my research results for a wider audience, who might just have some passing interest in them. The questions I’m asking affect a whole lot of people. In fact, I dare say that they affect almost everyone. They certainly can affect everyone’s thinking as they approach teamwork at home and at work, as well as how they consider political candidates asking for their votes.
For example, a little over a year from now, you’re going to have the opportunity to vote for who you want running the United States Government’s Executive Branch as well as a few of the people you’ll hire (or re-hire) to run the Legislative Branch. Altogether, those guys form a fairly important decision-making team. A lot of folks have voiced disapprobation with how the people we’ve hired in the past have been doing those jobs. My research has implications for what questions you ask of the bozos who are going to be asking for your votes in the 2020 elections.
One of the likely candidates for President has shown in words and deeds over the past two years (actually over the past few decades, if you care to look that far into his past) that he likes to make decisions all by his lonesome. In other words, he likes to have a decision team numbering exactly one member: himself.
Those who have paid attention to this column (specifically the posting of 17 July) can easily compute the diversity score for a team like that. It’s exactly zero.
When looking at candidates for the Legislative Branch, you’ll likely encounter candidates who’re excessively proud to promise that they’ll consult that Presidential candidate’s whims regarding anything, and support whatever he tells them he wants. Folks who paid attention to that 17 July posting will recognize that attitude as one of the toxic group-dynamics phenomena that destroy a decision team’s diversity score. If we elect too many of them to Congress and we vote Bozo #1 back into the Presidency, we’ll end up with another four years of the effective diversity of the U.S. Government decision team being close to or exactly equal to zero.
Preliminary results from my research – looking at results published by other folks asking what diversity or lack thereof does to the results of projects they make decisions for – indicates that decision teams with zero effective diversity are dumber than a box of rocks. Nobody’s done the research needed to make that statement look anything like Universal Truth, but several researchers have looked at outcomes of a lot of projects. They’ve all found that more diverse teams do better.
Anyway, what this research project is all about is studying the effect of team-member diversity on decision-team success. For that to make sense, it’s important to define two things: diversity and success. Even more important is to make them measurable.
I’ve already posted about how to make both diversity and success measurable. On 17 July I posted a summary of how to quantify diversity. On 7 August I posted a summary of my research (so far) into quantifying project success as well. This week I’m posting a summary of how I plan to put it all together and finally get some answers about how diversity really affects project-development teams.
Methodology
What I’m hoping to do with this research is to validate three hypotheses. The main hypothesis is that diversity (as measured by the Gini-Simpson index outlined in the 17 July posting) correlates positively with project success (as measured by the critical success index outlined in the 7 August posting). A secondary hypothesis is that four toxic group-dynamic phenomena reduce a team’s ability to maximize project success. A third hypothesis is that there are additional unknown or unknowable factors that affect project success. The ultimate goal of this research is to estimate the relative importance of these factors as determinants of project success.
Understanding the methodology I plan to use begins with a description of the information flows within an archetypal development project. I then plan on conducting an online survey to gather data on real world projects in order to test the hypothesis that it is possible to determine a mathematical function that describes the relationship between diversity and project success, and to elucidate the shape of such a function if it exists. Finally, the data can help gauge the importance of group dynamics to team-decision quality.
The figure above schematically shows the information flows through a development project. External factors determine project attributes. Personal attributes, such as race, gender, and age combine with professional attributes, such as technical discipline (e.g., electronics or mechanical engineering) and work experience to determine raw team diversity. Those attributes combine with group dynamics to produce an effective team diversity. Effective diversity affects both project planning and project execution. Additional inputs from stakeholder goals and goals of the sponsoring enterprise also affect the project plans. Those plans, executed by the team, determine the results of project execution.
The proposed research will gather empirical data through an online survey of experienced project managers. Following the example of researchers van Riel, Semeijn, Hammedi, & Henseler (2011), I plan to invite members of the Project Management Institute (PMI) to complete an online survey form. Participants will be asked to provide information about two projects that they have been involved with in the past – one they consider to be successful and one that they consider less successful. This is to ensure that data collected includes a range of project outcomes.
There will be four parts to the survey. The first part will ask about the respondent and the organization sponsoring the project. The second will ask about the project team and especially probe the various dimensions of team diversity. The third will ask about goals expressed for the project both by stakeholders and the organization, and how well those goals were met. Finally, respondents will provide information about group dynamics that played out during project team meetings. Questions will be asked in a form similar to that used by van Riel, Semeijn, Hammedi, & Henseler (2011): Respondents will rate their agreement with statements on a five- or seven-step Likert scale.
The portions of the survey that will be of most importance will be the second and third parts. Those will provide data that can be aggregated into diversity and success indices. While privacy concerns will make masking identities of individuals, companies and projects important, it will be critical to preserve links between individual projects and data describing those project results.
This will allow creating a two-dimensional scatter plot with indices of team diversity and project success as independent and dependent variables respectively. Regression analysis of the scatter plot will reveal to what extent the data bear out the hypothesis that team diversity positively correlates with project success. Assuming this hypothesis is correct, analysis of deviations from the regression curve (n-way ANOVA) will reveal the importance of different group dynamics effects in reducing the quality of team decision making. Finally, I’ll need to do a residual analysis to gauge the importance of unknown factors and stochastic noise in the data.
Altogether this research will validate the three hypotheses listed above. It will also provide a standard methodology for researchers who wish to replicate the work in order to verify or extend it. Of course, validating the link between team diversity and decision-making success has broad implications for designing organizations for best performance in all arenas of human endeavor.
References
de Rond, M., & Miller, A. N. (2005). Publish or perish: Bane or boon of academic life? Journal of Management Inquiry, 14(4), 321-329.
van Riel, A., Semeijn, J., Hammedi, W., & Henseler, J. (2011). Technology-based service proposal screening and decision-making effectiveness. Management Decision, 49(5), 762-783.
Luca Filippi driving through turn 1 during the ABB FIA Formula E Zurich ePrix on June 10, 2018 in Zurich, Switzerland. Photo by Oskar Schuler/Shutterstock
28 August 2019 – The short answer is, to quote Pooh Bear in A.A. Milne’s Winnie-the-Pooh, “You never can tell with bees!” Or, with advancing technology, for that matter. Last week, however, the Analytics Team at Autolist published results of a survey of 1,567 current car shoppers that might shed some light on the question of whether electric vehicles (EVs) can fully replace vehicles with internal combustion engines (ICEs).
The Analytics Team asked survey respondents what were their biggest reasons to not buy an electric vehicle. By looking at the results, we can project when, how, and if e-vehicle technology can ever surmount car-shoppers’ objections.
The survey results were spectacularly unsurprising. The top three barriers to purchasing an electric vehicle were:
Concerns about lack of adequate range;
E-vehicles’ relatively high cost compared to similar gas vehicles; and
Concerns about charging infrastructure.
Anybody following the development of electric vehicles already knew that. Most folks could even peg the order of concern. What was somewhat surprising, though, is how little folks’ trepidation dropped off for less significant concerns. Approximately 42% of respondents cited adequate range as a concern. The score dropped only to about 14% for the ninth-most-concerning worry: being unhappy with choices of body style.
Survey respondants cited lack of adequate range as their biggest concern about buying an electric vehicle. Source: Autolist
What that means for development of electric-vehicle technology is that resolving the top three issues won’t do the job. Resolving the top three issues would just elevate the next three issues to top-concern status for 25-30% of potential customers. That’s still way too high to allow fully replacing ICE-powered vehicles with EVs, as nine European countries (so far) have announced they want to do between 2020 and 2050.
Looking at what may be technologically feasible could give a glimpse of how sane or insane such ICE bans might be. What we can do is go down the list and speculate on how tough it will be to overcome each obstacle to full adoption. The Pareto chart above will show the “floor” to folks’ resistance if any of these issues remains unmet.
Top Three Issues
By inspection the Pareto chart shows natural breaks into three groups of three. The top three concerns (range, cost, and charging) all concern roughly 40% of respondents. That’s approximately the size of the political base that elected Donald Trump to be President of the United States in 2016.
I mention Trump’s political base to give perspective for how important a 40% rating really is. Just as 40% acceptance got Trump over the top in a head-to-head competition with Hillary Clinton, a 40% non-acceptance is enough to doom electric vehicles in a head-to-head competition with ICE-powered vehicles. So, what are the chances of technologically fixing those problems?
Lack of Range is just a matter of how much energy you can backpack onto an electric vehicle. The inputs to that calculation are how far you can drive on every Joule of energy (for comparison, 3,600 Joules equal one Watt-hour of energy) and how many Joules can you pack into a battery that an electric vehicle can reasonably carry around. I don’t have time to research these data points today, since I have only a few hours left to draft this essay, so I’m just not going to do it.
There are two ways, however, that we can qualitatively guesstimate the result. First, note that EV makers have already introduced models that they claim can go as far on one “fill up” (i.e., recharge) as is typical for ICE vehicles. That’s in the range of 200 to 300 miles. I can report that my sportscar goes pretty close to 200 miles on a tankful of gas, and that’s adequate for most of the commuting I’ve done over my career.
The second way to guesstimate the result is to watch progress of the Formula E electric-vehicle races. Formula E has been around for nearly a decade now (the first race was run in 2011), so we have some history to help judge the pace of technological developments.
The salient point that Formula E history makes is that battery range is improving. In previous events batteries couldn’t last a reasonable race distance. Unlike other forms of motor racing, where refueling takes just a few seconds, it takes too darn long to charge up an electric vehicle to make pit stops for refueling viable.
The solution was to have two cars for each racer. About half way through the race, the first car’s batteries would run out of juice, and the driver would have to jump into the second car to complete the race. This uncomfortable situation lasted through the last racing season (2018).
This year, however, I’m told that the rules have been changed to require racers to complete the entire race in one car on one battery charge. That tells us that e-technology has advanced enough to allow racers to complete a reasonable race distance at a reasonable race speed on one charge from a reasonable battery pack. That means e-vehicle developers have made significant progress on the range-limitation issue. Projecting into the future, we can be confident that range limits will soon become a non-issue.
High e-vehicle cost will also soon become a non-issue. History plainly shows that if folks are serious about mass-marketing anything, purchase prices will come down to a sustainable level. While Elon Musk’s Tesla hasn’t yet shown a profit while the company struggles to produce enough cars to fill even today’s meager electric-vehicle demand, there are some very experienced and professional automobile manufacturers also in the electric-vehicle game. Anyone who thinks those guys won’t be able to solve the mass-production-at-a-reasonable-cost problem for electric vehicles just hasn’t been paying attention over the past century and a quarter. They’re gonna do it, and they’ll do it very soon!
Charging infrastructure is similarly just a matter of doing it. It didn’t take the retail-gasoline vendors long to build out infrastructure to feed ICE-powered cars. Solving the EV-charging problem is not much more difficult. You just plunk charging stations down on every corner to replace the gasoline filling stations you’re going to close down because you’ve made ICE vehicles illegal.
Second-Tier Issues
The top three issues don’t seem to pose any insurmountable obstacles, so we can move on to the second-tier issues of recharging time, insufficient public knowledge, and battery life. All of these concerned just under 30% of survey respondents.
Charging time is the Achilles heel for EV technology. Currently, it takes hours to recharge an electric-car’s batteries. Charging speed is a matter of power, and that’s a serious limitation. It’s the real charging-infrastructure problem!
It takes less than a minute to pump ten gallons of gasoline into my sportscar’s fuel tank. That ten gallons can deliver approximately 1.2x10⁹ Joules of energy. That’s 1.2 billion Watt seconds!
To cram that much energy into a battery in one minute would take a power rate of 20 MW. That’s enough to power a medium-sized town of 26,000 people! Now, look at a typical gas station with eight gas pumps, and imagine each of those pumps pumping a medium-size-town’s worth of electric power into a waiting EV’s battery. Now, count the number of gas stations in your town.
That should give you some idea of the enormity of the charging-infrastructure problem that mass use of electric vehicles will create!
I’m not going to suggest any solutions to this issue. Luckily, since I don’t advocate for mass use of electric vehicles, I don’t have to solve this problem for people do. In the interest of addressing the rest of the issues, let’s pretend we’re liberal politicians and can wave our fairy wands to make the enormity of this issue magically disappear.
Inadequate public knowledge is a relative non-issue. Electric vehicles aren’t really difficult to understand. In fact, they should be simpler to operate than ICE vehicles. Especially since the prime mover EVs use is a motor rather than an engine.
Hardly anyone I know is conscious of the difference between a motor and an engine. Everyone knows it, but doesn’t think about it. Everyone knows that to run an ICE you have to crank it with a starter motor to get it running in the first place, and then you’ve got to constantly take care not to stall it. That knowledge becomes so ingrained by the time you get a driver’s license that you don’t even think about it.
Electric motors are not engines, though. They’re motors, which means they start all by themselves as soon as you feed them power. When you brake your electric car to a stop at a stop light, it just stops! You don’t have to then keep it chunking over at idle. Stopped is stopped.
When sitting at a stop light, or waiting for your spouse to load groceries into the boot, an EV uses no power ‘cause it’s stopped. When you’re ready to go, you push on the accelerator pedal, and it just goes. No more fiddling with clutch pedals or shifting gears or using any of the other mechanical skills manual-transmission cars force us to learn and automatic-transmission cars take care of for us automatically. The biggest thing we have to learn about driving EVs is how easy it is.
There isn’t much else to learn about EVs either. Gearheads will probably want to dig into things like regenerative braking and multipolar induction motors, but just folks won’t care. If the most important thing about your ICE-powered SUV is the number of cup holders, that will all be the same in your electric-powered SUV.
Overall battery life will be an issue for years going forward, but eventually that will become a non-issue, too. Overall battery life refers to the number of times your lithium-ion battery pack can be recharged before it swells up and bursts. Ten years from now we expect to have a better solution than lithium-ion batteries, but they aren’t all that bad a solution for now, anyway.
It was annoying when the relatively small lithium-ion battery pack in your Samsung smartphone burst into flames back in 2016, and you can imagine what’ll happen if the much larger battery pack in your Tesla does the same thing when sitting in the garage under your house. But, it’ll be less of a problem than when the battery packs in airliners started going up in smoke a few years ago. We got through that and we’ll get through this!
Third-Rate Concerns
Third-rate issues concerned 15-20% of survey respondents. They include issues around electric-motor reliability, battery materials, and vehicle designs. While they concerned relatively fewer respondents, enough people said they worried about them that they have to be addressed before EVs can fully replace ICE-powered vehicles.
Reliability concerned 20% of survey respondents. It shouldn’t. Electric motors have been around since William Sturgeon built the first practical one in 1832. They’ve proved to be extremely reliable with only two parts to wear out: the commutator brushes and the bearings. Unlike ICE power units, they need practically no regular maintenance. With modern solid-state power electronics taking the place of the old commutators, the only things left to wear out are the bearings, which take less punishment than the load-carrying wheel bearings all cars have.
Battery materials are a concern, but when viewed in perspective they shouldn’t be. Yes, lithium burns vigorously when exposed to air, and is especially flammable when exposed to water. But, gasoline burns just as vigorously when ignited by even a spark.
A tankful of gasoline can be responsible for a horrendous fire if ignited in an accident. Lithium ion batteries can cause similar mayhem, but are no more likely to do so than any other energy-storage medium.
Body size/style should not, to my mind, even be on the list. Electric-powered vehicles present fewer design constraints to coach builders than those with ICE power plants. In fact, it’s possible to design an EV chassis such that you can put any body on it that you can think of. Especially if you design that chassis with individually driven wheels, there are no drive-shaft and power-train issues to deal with.
Summing Up
Looking at the nine EV issues that survey respondents said would give them pause when considering the purchase of an electric vehicle rather than an ICE-powered vehicle, the only one not inevitably amenable to technological solution is the scale of the charging infrastructure. All of the others we can expect to be disposed of in short order as soon as we collectively decide we want to do it.
That charging infrastructure issue poses two problems: recharging time and recharging cost. The ten-gallon fuel tank in my sportscar typically gets me through about a week. That’s because I do relatively little commuting. I drive a round trip of about 60 miles to teach classes in Fort Myers twice a week. The rest of my driving is short local trips that burn up more than their fair share of gasoline because they’re stop-and-go driving.
In the past, I’ve had more difficult commute schedules that would have burned up a tankful of gas a day. Commuting more than 200 miles a day is almost unheard of. So, having to sit at a recharging station for hoursto top up batteries in the middle of a commute would be an unusual concern for a commuter. They would top up the batteries at home overnight.
Road trips, however, are another story. On a typical road trip, most people plan to burn up two tankfuls of fuel a day in two 4-5-hour stints. That’s why most vehicles have fuel tanks capable of taking them 200-300 miles. That’s about how far you can drive in a 4-5-hour stint. So, you drive out the tank, then stop for a while, which includes spending a minute or so refilling the tank. Then you’re ready to go on the next stint.
With an electric vehicle, however, which has to sit still for hours to recharge, that just doesn’t work. Instead of taking two days to drive to Virginia to visit my daughter, the trip would take most of a week. Electric vehicles are simply not suitable for road trips unless and until we solve the problem of supplying enough electric power to an EV’s battery to supply a small town!
Then, there’s the expense. If you’re going to recharge your EV once a week (or top it off from your wall outlet every night), you’ve gotta pay for that energy at the going rate. That 1.2 billion Joules translates into 333 kiloWatt hours added to your light bill every week. At a typical U.S. electricity rate of $0.12/kWh, that’s about $40. That may not seem like much, but compare it to the $25 I typically pay for a tankful of gas.
In conclusion, it looks like EVs will eventually do fine as dedicated commuter vehicles. They’ll cost a little more to run, but not enough to break most budgets. For road trips, however, they won’t work out well.
Thus, the answer to the question: “Can electric vehicles fully replace gas guzzlers?” is probably “No.” They’re fine for intra-city commuting, or commuting out to the suburbs, but unless Americans want to entirely forgo the possibility of taking road trips, ICE-powered vehicles will be needed for the foreseeable future.
14 August 2019 – There’s been some hand wringing in the mass media recently about negative interest rates and what they mean. Before you can think about that, however, you have to know what negative rates are and how they actually work. Journalists Sam Goldfarb and Daniel Kruger pointed out in a Wall Street Journal article on Monday (8/12) that not so long ago negative interest rates were thought impossible.
Of course, negative interest rates were never really “impossible.” They used to be considered highly unlikely, however, because nobody in their right mind would be willing to pay someone else for taking money off their hands. I mean, would you do it?
But, the world has changed drastically over the past, say, quarter century. Today, so-called “investors” think nothing of buying stock in giant technology companies, such as Tesla, Inc. that have never made a dime of profit and have no prospects of doing so in the near future. Such “investors” are effectively giving away their money at negative interest rates.
Buying stock in an unprofitable enterprise makes sense if you believe that the enterprise will eventually become profitable. Or, and this is a commonly applied strategy, you believe the market value of the stock will rise in the future, when you can sell it to somebody else at a profit. This latter strategy is known as the “bigger fool theory.” This theory holds that doing something that stupid is a good idea as long as you believe you’ll be able to find a “bigger fool” to take your stock in the deadbeat enterprise off your hands before it collapses into bankruptcy.
That all works quite nicely for stocks, but makes less sense for bonds, which is what folks are talking about when they wring their hands over negative-interest-rate policy by central banks. The difference is that in the bond market, there really is no underlying enterprise ownership that might turn a profit in the future. A bond is just an agreement between a lender and a debtor.
This is where the two-fluid model of money I trotted out in this column on 19 June helps paint an understandable picture. Recall from that column that money appears from nowhere when two parties, a lender and a debtor, execute a loan contract. The cash (known as “credit” in the model) goes to the debtor while an equal amount of debt goes to the lender. Those are the two paired “fluids” that make up what we call “money,” as I explain in that column.
Fed Funds Rate
The Federal Reserve Bank is a system of banks run by the U.S. Treasury Department. One of the system’s functions is to ensure the U.S. money supply by holding excess money for other banks who have more than they need at the moment, and loaning it out to banks in need of cash. By setting the interest rate (the so-called Fed Funds Rate) at which these transactions occur, the Fed controls how much money flows through the economy. Lowering the rate allows money to flow faster. Raising it slows things down.
Actual paper money represents only a tiny fraction of U.S. currency. In actual fact, money is created whenever anybody borrows anything from anybody, even your average loan shark. The Federal Reserve System is how the U.S. Federal Government attempts to keep the whole mess under control.
By the way, the problem with cryptocurrencies is that they attempt to usurp that control, but that’s a rant for another day.
Think of money as blood coursing through the country’s economic body, carrying oxygen to the cells (you and me and General Motors) that they use to create wealth. That’s when the problem with negative interest rates shows up. When interest rates are positive, it means wealth is being created. When they’re negative, well you can imagine what that means!
Negative interest rates mean folks are burning up wealth to keep the economic ship sailing along. If you keep burning up wealth instead of creating it, eventually you go broke. Think Venezuela, or, on a smaller scale, Puerto Rico.
Negative Interest
Okay, so how do negative interest rates actually work?
A loan contract, or bond, is an agreement between a lender and a debtor to create some money (the two fluids, again). The idea behind any contract is that everybody gets something out of it that they want. In a conventional positive-interest-rate bond, the debtor gets credit that they can use to create wealth, like, maybe building a house. The lender gets a share in that wealth in the form of interest payments over and above the cash needed to retire the loan (as in pay back the principal).
Bonds are sold in an auction process. That is, the issuer offers to sell the bond for a face value (the principal) and pay it back plus interest at a certain rate in the future. In the real world, however, folks buy such bonds at a market price, which may or may not be equal to the principal.
If the market price is lower than the principal, then the effective rate of interest will be higher than the offered rate because what the actual market value is doesn’t affect the pay-back terms written on the loan agreement. If the market price is higher than the principal, the effective rate will be lower than the offered rate. If the market price is too much higher than the principal, the repayment won’t be enough to cover it, and the effective rate will be negative.
Everyone who’s ever participated in an auction knows that there are always amateurs around (or supposed professionals whose glands get the better of their brains so they act like amateurs) who get caught up in the auction dynamics and agree to pay more than they should for what’s offered. When it’s a bond auction, that’s how you get a negative interest rate by accident. Folks agree to pay up front more than they get back as principal plus interest for the loan.
Negative Interest Rate Policy (NIRP) is when a central bank (such as the U.S. Federal Reserve) runs out of options to control economic activity, and publicly says it’s going to borrow money from its customers at negative rates. The Fed’s customers (the large banks that deposit their excess cash with the Fed) have to put their excess cash somewhere, so they get stuck making the negative-interest-rate loans. That means they’re burning up the wealth their customers share with them when they pay their loans back.
If you’re the richest country in the world, you can get away with burning up wealth faster than you create it for a very long time. If, on the other hand, you’re, say, Puerto Rico, you can’t.
Throughout history, applied mathematics has been the key to human development. By Elnur/Shutterstock
31 July 2019 – Over the millennia that philosophers have been doing their philosophizing, a recurring theme has been the quest to come up with some simple definition of what sets humans apart from so-called “lower” animals. This is not just idle curiosity. From Aristotle on, folks have realized that understanding what makes us human is key to making the most of our humanity. If we don’t know who we are, how can we figure out how to be better?
In recent decades, however, it’s become clear that this is a fool’s errand. Such a definition of humanity doesn’t exist. Instead, what sets humans apart is a suite of characteristics, such as two eyes in the front of a head that’s set up on a stalk over a main torso, with two legs down below and a couple of arms on each side ending with wiggly fingers and opposable thumbs; a brain able to use sophisticated language; and so forth. Not every human has all of them (for example, I had a friend in Arizona who’d managed to lose his right arm and shoulder without losing his humanity) and a lot of non-humans have some of them (for example, chimpanzees use tools a lot). What marks humans as humans is having most of these characteristics, and what marks non-humans as not human is lacking a lot of them.
On the other hand, there is one thing that most humans are capable of that most non-humans aren’t: humans are capable of doing the math.
Yeah, crows can count past two. I hear that pigeons are good at pattern recognition. But, I’m talking about mathematical reasoning more sophisticated than counting past seven. That’s something most humans can do, and most other animals can’t.
Everybody has their mathematical limitations.Experience indicates that one’s mathematical limitations are mostly an issue of motivation. At some point, just about everybody decides that it’s just not worth putting in the effort needed to learn any more math than they already know.
That’s because learning math is hard. It’s the biggest learning challenge most of us ever face. Most of us give up long before reaching the limits of our innate ability to puzzle it out.
Luckily, there are some who are willing to push the limits, and master mathematical puzzles that no human has solved before. That’s lucky because without people like them, human progress would quickly stop.
Even better, those people are often willing – even anxious – to explain what they’ve puzzled out to the rest of us. For example, we have geometry because a bunch of Egyptians puzzled out how to design pyramids, stone temples and other stuff they wanted to build, then proudly explained to their peers exactly how to do it. We have double-entry accounting because folks in the Near East wanted to keep track of what they had, figured out how to do it, and taught others to help. We’ve got calculus because Sir Isaac Newton and a bunch of his buddies figured out how to predict what the visible planets would do next, then taught it to a bunch of physics students.
It’s what we like to call “Applied Mathematics,” and it’s responsible for most of the progress people have made since the days of stone knives and bear skins. Throughout history, we’ve all stood around scratching our heads about things we couldn’t make sense of until some bright guy (or gal) worked out the right mathematics and applied it to the problem. Then, suddenly what had been unintelligible became understandable.
These days, what I think is the bleeding edge of applied mathematics is nonlinear dynamics and chaos. Maybe there’s some fuzzy logic thrown into the mix, too. Most of the math tools needed to understand (as in “make mathematical models using”) these things is pretty well in hand. What we need to do is apply such tools to the problems that today vex us.
A case in point is the Gini-Simpson Diversity Index I described in this blog two weeks ago. That is a small brick in the wall of a structure that I hope will someday help us avoid making so many dumb choices. Last week I ran across another brick in a paper written by a couple of computer science professors at my old alma materRensselaer Polytechnic Institute (aka RPI, or as we used to call it when I was there as a graduate student, “the Tute”). This bit of intellectual flotsam describes a mathematical model the authors use to predict how political polarization evolves in the U.S. Congress.
Polarization is one of four (at my last count) toxic group-dynamics phenomena that make collaborative decision making fail. Basically, the best decisions are made by groups that work together to reach a consensus. We get crappy decisions when the group’s dynamics break down.
The RPI model is a nonlinear differential equation describing an aspect of the dynamics of decision-making teams. Specifically, it quantifies conditions that determine whether decision teams evolve toward consensus or polarization. We see today what happens when Congress evolves toward polarization. The authors’ research shows that prior to about 1980 Congress evolved toward consensus. Seeing this dynamic at work mathematically gives us a leg up on figuring out why, and maybe doing something about it.
I’m not going to go into the mathematical model the RPI paper presents. The study of nonlinear dynamical systems is far outside the editorial focus of this column. At this point, I’m not going to talk about solutions the paper might suggest for toxic U.S. Government polarization, either. The theory is not well enough developed yet to provide meaningful suggestions.
The purpose of this posting is to point out that application of sophisticated mathematics is necessary for solving society’s most intractable problems. As I said above, not everybody is ready and willing to become expert in using such tools. That’s not necessary. What I hope you’ll walk away with today is an appreciation of applied mathematics’ importance for societal development, and a willingness to support STEM (science, technology, engineering and mathematics) education throughout our school system. Finally, I hope you’ll encourage students who show an interest to learn the techniques and follow STEM careers.
Maslow’s pyramid of needs analyzes human needs and arranges them in a hierarchy. By Shutter_M/Shutterstock
24 July 2019 – Abraham Harold Maslow (1908-1970) was a 20th century psychologist famous for describing human motivation as an hierarchy of needs in a 1943 paper entitled “A Theory of Human Motivation” published in Psychological Review. He was a central figure in the founding of Humanistic Psychology, which concentrates on studying mentally healthy humans.
You have to remember that Maslow did his most important work in the middle of the 20th century. At that time there was great popular interest in the works of Sigmund Freud, who worked with the mentally ill, and B.F. Skinner who mainly studied lower animals. Indeed, the entire arts-and-letters school of Surrealism explicitly drew inspiration from Andre Breton’s interpretation of Freud’s work. Despite (or perhaps because of) this interest in Freud and Skinner’s work, there had been little, if any, study of mentally healthy people.
Humanistic Psychologists felt these earlier studies were of limited value to understanding the healthy human mind. Maslow chose to study the workings of healthy human minds from all social strata, but he was especially interested in studying high achievers. For this reason those of us interested in organizational behavior find his humanists of particular interest. We kinda hope our organizations are populated with, and run by, mentally healthy humans, rather than Freud’s neurotics or Skinner’s lab rats!
Maslow’s emphasis on studying high achievers likely gave rise to the first misconception I want to talk about today: the idea that his work gives cover to elitist views. This elitist theory assumes that everyone strives to reach the self-actualization level at the top of the so-called “Pyramid of Needs” used to illustrate Maslow’s hierarchy, but that only an elite fraction of individuals reach it. Lesser individuals are doomed to wallowing in more squalid existences at lower levels.
The second misconception I want to treat today is a similar notion that people start out at the lower levels and climb slowly up to the top as their incomes rise. This theory substitutes a ladder for the pyramid image to visualize Maslow’s hierarchy. People are imagined to climb slowly up this ladder as both their income and social status increase. This, again, gives cover for elitist views as well as laissez-faire economics.
Maslow’s Conception
What Maslow’s Hierarchy really describes is a priority system that determines what people are motivated to do next. It has little to do with their talents, income or social status. To illustrate what I mean, I like to use the following thought experiment. This thought experiment involves Albert Einstein and it’s particularly appropriate because the Grizzled Genius loved thought experiments.
Albert Einstein’s greatest joy was becoming immersed in translating his imaginings about the physical universe into mathematical equations. This is an example of what Maslow called “peak experiences.” Maslow believed these were periods when self-actualized people (those engaged in satisfying their self-actualization need) are happiest and most productive.
Once in a while, however, Einstein would become hungry. Hunger is, however, one of those pesky physiological needs down at the bottom of Maslow’s Hierarchy. There’s nothing aspirational about hunger. It’s what Fredrick Herzberg called a “hygiene factor” or “demotivator.” Such needs are the opposite of aspirational.
If you’ve got an unsatisfied demotivator need, you become unhappy until you can satisfy it. If, for example, you’re hungry, or have a toothache, or need to pee, it becomes hard to concentrate on anything else. Your only thought is (depending on the nature of the unmet physiological need) to go to the bathroom, or the dentist, or, as in Einstein’s case, go find lunch.
The moral of this story is that people don’t sit somewhere for extended periods of time on a shelf labeled with one of Maslow’s categories. Rich people don’t float in a blissful self-actualizing state. Poor people don’t wallow in a miasma of permanently unmet physiological needs. People constantly move up and down the pyramid depending on what the most pressing unmet need of the moment is.
The hierarchy is therefore actually an inverted priority list. Physiological needs are more important than safety needs. When something frightens you – a safety need – the first thing that happens is you feel an urge to pee to take care of a physiological need to prepare your body for running like a scared rabbit. When you see a fast-moving Chevy bearing down on you, you immediately forget pride in that (esteem level) achievement award you just got.
Elitist Fallacy
A combination of confusion about how Maslow’s heirarchy works and his preference for studying high achievers has led many people to imagine his work gives cover for elitist views. If you’re predisposed to imagine that rich people, smart people, or those of high social status are somehow innately “better” than denizens of what 19th century novelist Edward Bulwer-Lytton called “the great unwashed,” then you’re an elitist. An elitist can derive great comfort by misinterpreting Maslow’s work. You can imagine there being a cadre of elite people destined to spend their lives in some ethereal existence where all lower needs are completely satisfied and life’s only pursuit is self actualization.
The poster child for elitism is 16th century theologian John Calvin. In Calvin’s version of Protestant theology everyone was tainted with original sin and doomed to an eternity in Hell. That was a pretty common view at the time of the Protestant Reformation. Calvin added an elitist element by hypothesizing that there was a limited number of individuals (the elect) whom God had chosen for salvation.
It’s called predestination and those folks got tickets into the elite ranks through no merit of their own. There was nothing anybody could do to beg, borrow, or steal their way in. God decided, while making the Universe in the first place, who was in and who was out based on nothing but His whimsey. (Sexist pronoun used specifically to make a point about Calvinism.)
Of course, the requirements of natural selection logically lead to everyone having a desire to be part of an elite. We all want to be different, like the Dada-esque avant garde group King Missile. That’s how DNA measures its success. Only elite DNA gets to have long-term survival.
So, elitism has a lot of natural appeal. This natural appeal accounts for all kinds of rampant racism and xenophobia. Misunderstanding Maslow’s heirarchy provides a pseudoscientific rationale for elitism. To the elitist, the fact that this view is completely mistaken makes no nevermind.
I hope that by now I have disposed of the elitist fallacy.
Economic Ladder Fallacy
Hoping that I’ve disposed of the idea that Maslow’s work gives cover to elitism, I’ll turn to the fallacy of imagining his hierarchy as an economic ladder. This puppy is a natural outgrowth of the Pyramid of Needs image. The top (self actualization) level of the pyramid is imagined as “higher” than the bottom (physiological) level.
This image actually works from the viewpoint that “lower” needs take precedence over “higher” needs in the same way that a building’s supporting foundation takes precedence over the walls and roof. Without a foundation, there’s nothing to support walls or a roof in the same way that without fulfilling physiological needs, there’s no motivation for, say, self actualization.
Think of it this way: dead people, whose physiological needs are all unmet, hardly ever want to run for President.
So, how do you reach something high? You use a ladder!
That’s the thinking that transforms the Pyramid of Needs into some kind of ladder.
If you’re a strict materialist (and way too many Americans are strict materialists) the “high” you care about reaching is wealth. Folks who haven’t understood last month’s posting entitled “The Fluidity of Money” often confuse income with wealth, so there’s some appeal to thinking about Maslow’s Hierarchy of Needs as a metaphor for income levels. That completes the economic-ladder fallacy.
With this fallacy, folks imagine that everyone starts out at the bottom of the ladder and, with time, hard work and luck, climbs their way to the top. There are obvious problems matching income levels with needs levels, but if you’re sufficiently intellectually lazy, you can unfocus your mind’s eye enough to render these problems invisible.
I especially get a kick out of efforts to use the idea of Engel curves (from economics) to make this ladder fallacy work. Engel curves map the desireability (measured as the demand side of the economics law of supply and demand) of a given good or product against a given consumer’s income level. If the good in question is, for example, a used Mazda Miata, the desirability may be high when the consumer has a low-to-moderate income, but low if that particular consumer has enough income to pay for a new Ferrari SF90 Stradale. If you want to, it is obvious you can somehow conflate Engel curves with the ladder idea of Maslow’s Heirarchy of Needs.
The problem with this thinking is, first, that the Ladder doesn’t make a lot of sense as a visualization for Maslow’s Heirarchy, since the latter is formost a priority-setting scheme; second, that Maslow’s Hierarchy has little connection to income; and, third, that Engel curves present an incomplete view of what makes a product desirable.
The elitist fallacy and the economic-ladder fallacy are not the only fallacies people, with their infinite capacity to generate cockamamie theories, can concoct in connection to Maslow’s work. They are just two that have come up recently in articles I’ve had occasion to read. I think analyzing them can also help clarify how the Hierarchy of Needs applies to understanding human behavior.
Besides, I’ve had a bit of fun knocking them around, and I hope you have, too.
Diversity of membership in decision-making teams leads to better outcomes. By Rawpixel.com/Shutterstock
17 July 2019 – It’s come to my attention that a whole lot of people don’t know how to calculate a diversity score, or even that such a thing exists! How can there be so much discussion of diversity and so little understanding of what the word means? In this post I hope to give you a peek behind the curtain, and maybe shed some light on what diversity actually is and how it is measured.
This topic is of particular interest to me at present because momentum is building to make a study of diversity in business-decision making the subject of my doctoral dissertation in Business Administration. Specifically, I’m looking at how decision-making teams (such as boards of directors) can benefit from membership diversity, and what can go wrong.
Estimating Diversity
The dictionary definition of diversity is: “the condition of having or being composed of differing elements.”
So, before we can quantify the diversity of any group, we’ve got to identify what makes different elements different. This, by the way, is all basic set theory. In different contexts what we mean by “different” may vary. When we’re talking about group decision making in a business context, it gets pretty complicated.
A group may be subdivided, or “stratified” along various dimensions. For example, a team of ten people sitting around a table trying to figure out what to do next about, say, a new product could be subdivided in various ways. One way to stratify such a group is by age. You’d have so many individuals in their 20’s, so many might be in their 30’s, and so forth up to the oldest group being aged 50 or more. Another (perhaps more useful) way to subdivide them is by specialty. There may be so many software engineers, so many hardware engineers, so many marketers, and so forth. These days stratifying teams by gender, ethnicity, educational level or political persuasion could be important. What counts as diversity depends on what the team is trying to decide.
The moral of this story is that a team might score high in diversity along one dimension and very poorly along another. I’m not going to say any more about diversity’s multidimensional nature in this essay, however. We have other fish to fry today.
For now, let’s assume a one-dimensional diversity index. What we pick for a dimension makes little difference to the mathematics we use. Let’s just imagine a medium-sized group of, say, ten individuals and stratify them according to the color of tee-shirts they happen to be wearing at the moment.
What the color of their tee-shirts could possibly mean for the group’s decisions about new-product development I can’t imagine, and probably wouldn’t care anyway. It does, however, give us a way to stratify the sample. Let’s say their shirt colors fall out as in Table 1. So, we’ve got five categories of team members stratified by tee-shirt color.
NOTE: The next bit is mathematically rigorous enough to give most people nosebleeds. You can skip over it if you want to, as I’m going to follow it with a more useful quick-and-dirty estimation method.
The Gini–Simpson diversity index, which I consider to be the most appropriate for evaluating diversity of decision-making teams, has a range of zero to one, with zero being “everybody’s the same” and one being “everybody’s different.” We start by asking: “What is the probability that two members picked at random have the same color tee shirt?”
If you’ve taken my statistical analysis course, you’ll likely loathe remembering that the probability of picking two things from a stratified data set, and having them both fall into the same category is:
Where λ is the probability we want, N is the number of categories (in this case 5), and P is the probability that, given the first pick falling into a certain category (i) the second pick will be in the same category. The superscript 2 just indicates that we’re taking members two at a time. Basically P is the number of members in category i divided by the total number of members in all categories. Thus, if the first pick has a blue tee-shirt, then P is 3/10 = 0.3.
This probability is high when diversity is low, and low when diversity is high. The Gini-Simpson index makes more intuitive sense by simply subtracting that probability from unity (1.0) to get something that is low when diversity is low, and high when diversity is high.
NOTE: Here’s where we stop with the fancy math.
Guesstimating Diversity
Veteran business managers (at least those not suffering from pathological levels of OCD) realize that the vast majority of business decisions – in fact most decisions in general – are not made after extensive detailed mathematical analysis like what I presented in the previous section. In fact, humans have an amazing capacity for making rapid decisions based on what’s called “fuzzy logic.”
Fuzzy logic recognizes that in many situations, precise details may be difficult or impossible to obtain, and may not make a significant difference to the decision outcome, anyway. For example, deciding whether to step out to cross a street could be based on calculations using precise measurements of an oncoming car’s speed, distance, braking capacity, and the probability that the driver will detect your presence in time to apply the brakes to avoid hitting you.
But, it’s usually not.
If we had to make the decision by the detailed mathematical analysis of physical measurements, we’d hardly ever get across the street. We can’t judge speed or distance accurately enough, and have no idea whether the driver is paying attention. We don’t, in general, make these measurements, then apply detailed calculations using Gallilean Transformations to decide if now is a safe time to cross.
No, we have, with experience over time, developed a “gut feel” for whether it’s safe. We use fuzzy categories of “far” and “near,” and “slow” or “fast.” Even the terms “safe” and “unsafe” have imprecise meanings, gradually shifting from one to the other as conditions change. For example “safe to cross” means something quite different on a dry, sunny day in summertime, than when the pavement has a slippery sheen of ice.
Group decision making has a similar fuzzy component. We know that the decision team we’ve got is the decision team we’re going to use. It makes no difference whether it’s diversity score is 4.9 or 5.2, what we’ve got is what we’re going to use. Maybe we could make a half-percent improvement in the odds of making the optimal decision by spending six months recruiting and training a blind Hispanic woman with an MBA to join the team, but are we going to do it? Nope!
We’ll take our chances with the possibly sub-optimal decision made by the team we already have in place.
Hopefully we’re not trying to work out laws affecting 175 million American women with a team consisting of 500 old white guys, but, historically, that’s the team we’ve had. No wonder we’ve got so many sub-optimal laws!
Anyway, we don’t usually need to do the detailed Gini-Simpson Diversity Index calculation to guesstimate how diverse our decision committee is. Let’s look at some examples whose diversity indexes are easy to calculate. That will help us develop a “gut feel” for diversity that’ll be useful in most situations.
So, let’s assume we look around our conference room and see six identical white guys and six identical white women. It’s pretty easy to work out that the team’s diversity index is 0.5. The only way to stratify that group is by gender, and the two strata are the same size. If our first pick happens to be a woman, then there’s a 50:50 chance that the second pick will be a woman, too. One minus that probability (0.5) equals 0.5.
Now, let’s assume we still have twelve team members, but eleven of them are men and there’s only one token woman. If your first pick is thewoman, the probability of picking a woman again is 1/12 = 0.8. (The Gini-Simpson formula lets you pick the same member twice.) If, on the other hand, your first pick is a man, the probability that the second pick will also be a man is 11/12 = 0.92. I plugged all this into an online Gini-Simpson-Index calculator (‘cause I’m lazy) and it returned a value of 26%. That’s a whole lot worse.
Let’s see what happens when we maximize diversity by making everyone different. That means we end up stratifying the members into twelve segments. After picking one member, the odds of the second pick being identical are 1/12 = 0.8 for every segment. The online calculator now gives us a diversity index of 91.7%. That’s a whole lot better!
What Could Possibly Go Wrong?
There are two main ways to screw up group diversity: group-think and group-toxicity. These are actually closely related group-dynamic phenomena. Both lower the effective diversity.
Group-think occurs when members are too accommodating. That is, when members strive too hard to reach consensus. They look around to see what other members want to do, and agree to it without trying to come up with their own alternatives. This produces sub-optimal decisions because the group fails to consider all possible alternatives.
Toxic group dynamics occurs when one or more members dominate the conversation either by being more vocal or more numerous. Members with more reticent personalities fail to speak up, thus denying the group their input. Whenever a member fails to speak up, they lower the group’s effective diversity.
A third phenomenon that messes up decision making for high-diversity teams is that when individual members are too insistent that their ideas are the best, groups often fail to reach consensus at all. At that point more diversity makes reaching consensus harder. That’s the problem facing both houses of the U.S. Congress at the time of this writing.
These phenomena are present to some extent in every group discussion. It’s up to group leadership to suppress them. In the end, creating an effective decision-making team requires two elements: diversity in team membership, and effective team leadership. Membership diversity provides the raw material for effective team decision making. Effective leadership mediates group dynamics to make it possible to maximize the team’s effective diversity.