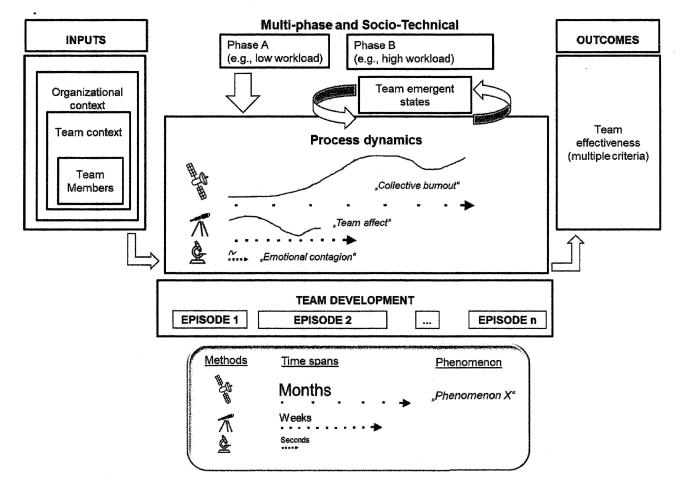
A temporal framework to understand team dynamics with high resolution. Image by Klonek et al
30 October 2019 – The essay below was posted to the Keiser University DBA 710 Week 8 Discussion Forum. It is reproduced here in the hope that readers of this blog will find this peek into state-of-the-art management research interesting.
This posting is a bit off topic for Week 8, but it reviews a paper that didn’t cross my desk in time to be included in last week’s discussions, where it would have been more appropriate. In fact, the copy of the paper I received was a manuscript version of a paper accepted by the journal Organizational Psychology Review that is at the printer now.
The paper, written by an Australian-German team, covers recent developments in measuring variables apropos management of decision teams in various situations (Klonek, Gerpott, Lehmann-Willenbrock & Parker, in press). As we saw last week, there is a lot of work to be done on metrology of leadership and management variables. The two main metrology-tool classifications are case studies (Pettigrew, 1990) and surveys (Osei-Kyei & Chan, 2018). Both involve time lags that make capturing data in real time and assuring its freedom from bias impossible (Klonek, Gerpott, Lehmann-Willenbrock & Parker, in press). Decision teams, however, present a dynamic environment where decision-making processes evolve over time (Lu, Gao & Szymanski, 2019). To adequately study such processes requires making time resolved measurements quickly enough to follow these dynamic changes.
Recent technological advances change that situation. Wireless sensor systems backed by advanced data-acquisition software make in possible to unobtrusively monitor team members’ activities in real time (Klonek, Gerpott, Lehmann-Willenbrock & Parker, in press). The paper describes how management scholars can use these tools to capture useful information for making and testing management theories. It provides a step-by-step breakdown of the methodology, including determining the appropriate time-resolution target, choosing among available metrology tools, capturing data, organizing data, and interpreting data. It covers working on time scales from milliseconds to months, and mixed time scales. Altogether, the paper provides invaluable information for anyone intending to link management theory and management practice in an empirical way (Bartunek, 2011).
References
Bartunek, J. M. (2011). What has happened to Mode 2? British Journal of Management, 22(3), 555–558.
Klonek, F.E., Gerpott, F., Lehmann-Willenbrock, N., & Parker, S. (in press). Time to go wild: How to conceptualize and measure process dynamics in real teams with high resolution? Organizational Psychology Review.
Lu, X., Gao, J. & Szymanski, B. (2019) The evolution of polarization in the legislative branch of government. Journal of the Royal Society Interface, 16: 20190010.
Osei-Kyei, R., & Chan, A. (2018). Evaluating the project success index of public-private partnership projects in Hong Kong. Construction Innovation, 18(3), 371-391.
Pettigrew, A. M. (1990). Longitudinal Field Research on Change: Theory and Practice. Organization Science, 1(3), 267–292.
Diversity of membership in decision-making teams leads to better outcomes. By Rawpixel.com/Shutterstock
17 July 2019 – It’s come to my attention that a whole lot of people don’t know how to calculate a diversity score, or even that such a thing exists! How can there be so much discussion of diversity and so little understanding of what the word means? In this post I hope to give you a peek behind the curtain, and maybe shed some light on what diversity actually is and how it is measured.
This topic is of particular interest to me at present because momentum is building to make a study of diversity in business-decision making the subject of my doctoral dissertation in Business Administration. Specifically, I’m looking at how decision-making teams (such as boards of directors) can benefit from membership diversity, and what can go wrong.
Estimating Diversity
The dictionary definition of diversity is: “the condition of having or being composed of differing elements.”
So, before we can quantify the diversity of any group, we’ve got to identify what makes different elements different. This, by the way, is all basic set theory. In different contexts what we mean by “different” may vary. When we’re talking about group decision making in a business context, it gets pretty complicated.
A group may be subdivided, or “stratified” along various dimensions. For example, a team of ten people sitting around a table trying to figure out what to do next about, say, a new product could be subdivided in various ways. One way to stratify such a group is by age. You’d have so many individuals in their 20’s, so many might be in their 30’s, and so forth up to the oldest group being aged 50 or more. Another (perhaps more useful) way to subdivide them is by specialty. There may be so many software engineers, so many hardware engineers, so many marketers, and so forth. These days stratifying teams by gender, ethnicity, educational level or political persuasion could be important. What counts as diversity depends on what the team is trying to decide.
The moral of this story is that a team might score high in diversity along one dimension and very poorly along another. I’m not going to say any more about diversity’s multidimensional nature in this essay, however. We have other fish to fry today.
For now, let’s assume a one-dimensional diversity index. What we pick for a dimension makes little difference to the mathematics we use. Let’s just imagine a medium-sized group of, say, ten individuals and stratify them according to the color of tee-shirts they happen to be wearing at the moment.
What the color of their tee-shirts could possibly mean for the group’s decisions about new-product development I can’t imagine, and probably wouldn’t care anyway. It does, however, give us a way to stratify the sample. Let’s say their shirt colors fall out as in Table 1. So, we’ve got five categories of team members stratified by tee-shirt color.
NOTE: The next bit is mathematically rigorous enough to give most people nosebleeds. You can skip over it if you want to, as I’m going to follow it with a more useful quick-and-dirty estimation method.
The Gini–Simpson diversity index, which I consider to be the most appropriate for evaluating diversity of decision-making teams, has a range of zero to one, with zero being “everybody’s the same” and one being “everybody’s different.” We start by asking: “What is the probability that two members picked at random have the same color tee shirt?”
If you’ve taken my statistical analysis course, you’ll likely loathe remembering that the probability of picking two things from a stratified data set, and having them both fall into the same category is:
Where λ is the probability we want, N is the number of categories (in this case 5), and P is the probability that, given the first pick falling into a certain category (i) the second pick will be in the same category. The superscript 2 just indicates that we’re taking members two at a time. Basically P is the number of members in category i divided by the total number of members in all categories. Thus, if the first pick has a blue tee-shirt, then P is 3/10 = 0.3.
This probability is high when diversity is low, and low when diversity is high. The Gini-Simpson index makes more intuitive sense by simply subtracting that probability from unity (1.0) to get something that is low when diversity is low, and high when diversity is high.
NOTE: Here’s where we stop with the fancy math.
Guesstimating Diversity
Veteran business managers (at least those not suffering from pathological levels of OCD) realize that the vast majority of business decisions – in fact most decisions in general – are not made after extensive detailed mathematical analysis like what I presented in the previous section. In fact, humans have an amazing capacity for making rapid decisions based on what’s called “fuzzy logic.”
Fuzzy logic recognizes that in many situations, precise details may be difficult or impossible to obtain, and may not make a significant difference to the decision outcome, anyway. For example, deciding whether to step out to cross a street could be based on calculations using precise measurements of an oncoming car’s speed, distance, braking capacity, and the probability that the driver will detect your presence in time to apply the brakes to avoid hitting you.
But, it’s usually not.
If we had to make the decision by the detailed mathematical analysis of physical measurements, we’d hardly ever get across the street. We can’t judge speed or distance accurately enough, and have no idea whether the driver is paying attention. We don’t, in general, make these measurements, then apply detailed calculations using Gallilean Transformations to decide if now is a safe time to cross.
No, we have, with experience over time, developed a “gut feel” for whether it’s safe. We use fuzzy categories of “far” and “near,” and “slow” or “fast.” Even the terms “safe” and “unsafe” have imprecise meanings, gradually shifting from one to the other as conditions change. For example “safe to cross” means something quite different on a dry, sunny day in summertime, than when the pavement has a slippery sheen of ice.
Group decision making has a similar fuzzy component. We know that the decision team we’ve got is the decision team we’re going to use. It makes no difference whether it’s diversity score is 4.9 or 5.2, what we’ve got is what we’re going to use. Maybe we could make a half-percent improvement in the odds of making the optimal decision by spending six months recruiting and training a blind Hispanic woman with an MBA to join the team, but are we going to do it? Nope!
We’ll take our chances with the possibly sub-optimal decision made by the team we already have in place.
Hopefully we’re not trying to work out laws affecting 175 million American women with a team consisting of 500 old white guys, but, historically, that’s the team we’ve had. No wonder we’ve got so many sub-optimal laws!
Anyway, we don’t usually need to do the detailed Gini-Simpson Diversity Index calculation to guesstimate how diverse our decision committee is. Let’s look at some examples whose diversity indexes are easy to calculate. That will help us develop a “gut feel” for diversity that’ll be useful in most situations.
So, let’s assume we look around our conference room and see six identical white guys and six identical white women. It’s pretty easy to work out that the team’s diversity index is 0.5. The only way to stratify that group is by gender, and the two strata are the same size. If our first pick happens to be a woman, then there’s a 50:50 chance that the second pick will be a woman, too. One minus that probability (0.5) equals 0.5.
Now, let’s assume we still have twelve team members, but eleven of them are men and there’s only one token woman. If your first pick is thewoman, the probability of picking a woman again is 1/12 = 0.8. (The Gini-Simpson formula lets you pick the same member twice.) If, on the other hand, your first pick is a man, the probability that the second pick will also be a man is 11/12 = 0.92. I plugged all this into an online Gini-Simpson-Index calculator (‘cause I’m lazy) and it returned a value of 26%. That’s a whole lot worse.
Let’s see what happens when we maximize diversity by making everyone different. That means we end up stratifying the members into twelve segments. After picking one member, the odds of the second pick being identical are 1/12 = 0.8 for every segment. The online calculator now gives us a diversity index of 91.7%. That’s a whole lot better!
What Could Possibly Go Wrong?
There are two main ways to screw up group diversity: group-think and group-toxicity. These are actually closely related group-dynamic phenomena. Both lower the effective diversity.
Group-think occurs when members are too accommodating. That is, when members strive too hard to reach consensus. They look around to see what other members want to do, and agree to it without trying to come up with their own alternatives. This produces sub-optimal decisions because the group fails to consider all possible alternatives.
Toxic group dynamics occurs when one or more members dominate the conversation either by being more vocal or more numerous. Members with more reticent personalities fail to speak up, thus denying the group their input. Whenever a member fails to speak up, they lower the group’s effective diversity.
A third phenomenon that messes up decision making for high-diversity teams is that when individual members are too insistent that their ideas are the best, groups often fail to reach consensus at all. At that point more diversity makes reaching consensus harder. That’s the problem facing both houses of the U.S. Congress at the time of this writing.
These phenomena are present to some extent in every group discussion. It’s up to group leadership to suppress them. In the end, creating an effective decision-making team requires two elements: diversity in team membership, and effective team leadership. Membership diversity provides the raw material for effective team decision making. Effective leadership mediates group dynamics to make it possible to maximize the team’s effective diversity.